Download 2021 USDA NAIP 4-Band 8 Bit Imagery for Louisiana from NOAA Digital Coast Data Access Viewer.
Setup
# Import modules
import sys
import subprocess
from pathlib import Path
from contextlib import suppress

# Find GRASS Python packages
sys.path.append(
  subprocess.check_output(
    ["grass", "--config", "python_path"],
    text=True
    ).strip()
  )

# Import GRASS packages
import grass.script as gs
import grass.jupyter as gj
from grass.tools import Tools

# Create and initialize GRASS project
try:
    gj.init("hilltop")
except ValueError:
    with suppress(ValueError):
        gs.create_project("hilltop", epsg="2801")
        gj.init("hilltop")
tools = Tools(overwrite=True)

# Print projection
projection = tools.g_proj(format="shell", flags="p").keyval
print(projection.get("name"))
NAD83(HARN) / Louisiana South
Set region
# Set region
tools.g_region(n=206019.34802663, s=205675.10652713, e=1023034.67463463, w=1022764.8431352, res=0.3)
tools.v_in_region(output="region")
Import imagery
# Set path
data = Path.cwd() / "data" / "naip_2021_4BandImagery_Louisiana_J1469548tR0_C0.tif"

# Import imagery
tools.r_import(input=data, output="imagery", extent="region")

# List imagery
tools.g_list(type="raster", pattern="imagery*")

# Composite imagery
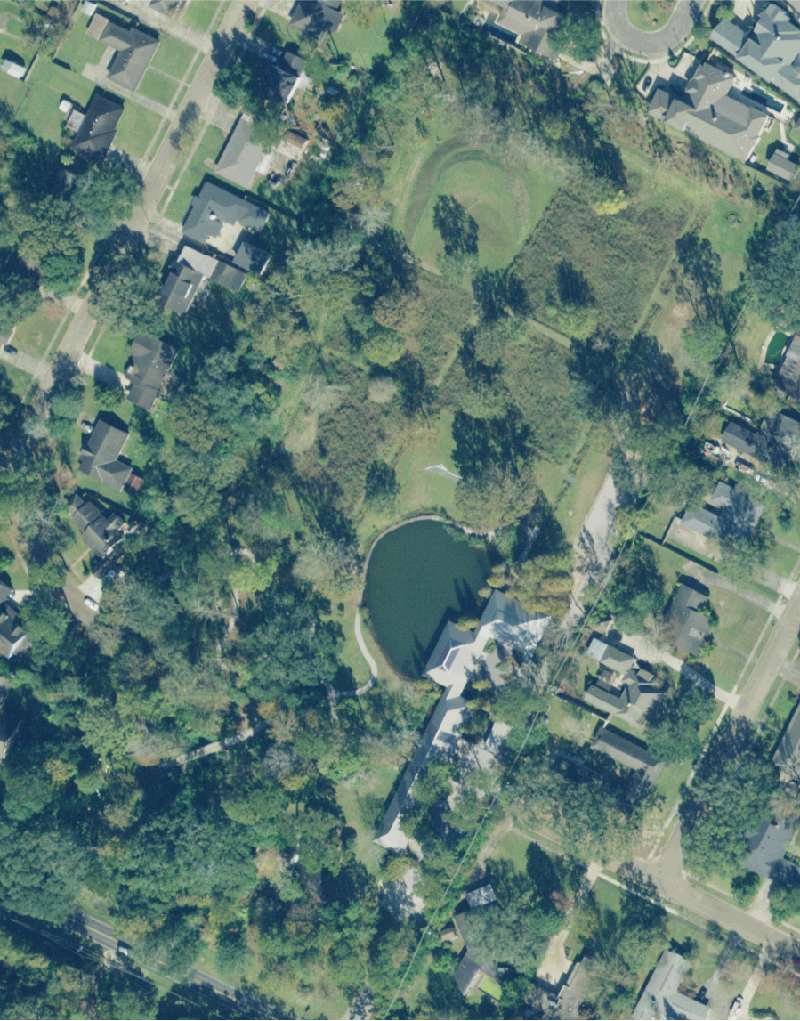
tools.r_composite(red="imagery.1", green="imagery.2", blue="imagery.3", output="imagery")

# Visualize imagery
m = gj.Map(width=800)
m.d_rast(map="imagery")
m.show()
False color
# Composite false color imagery
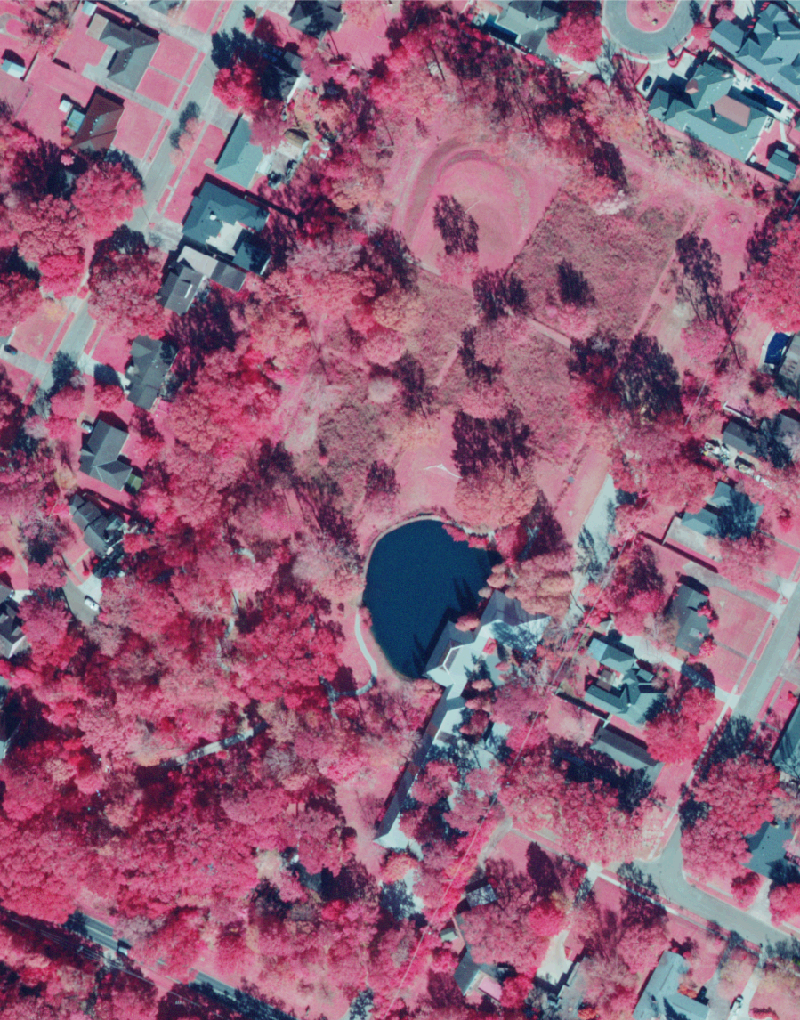
tools.r_composite(red="imagery.4", green="imagery.1", blue="imagery.2", output="false_color")

# Visualize imagery
m = gj.Map(width=800)
m.d_rast(map="false_color")
m.show()
Normalized Difference Vegetation Index
Normalized Difference Vegetation Index (NDVI)
NDVI = (NIR - Red) / (NIR + Red)
# Calculate Normalized Difference Vegetation Index
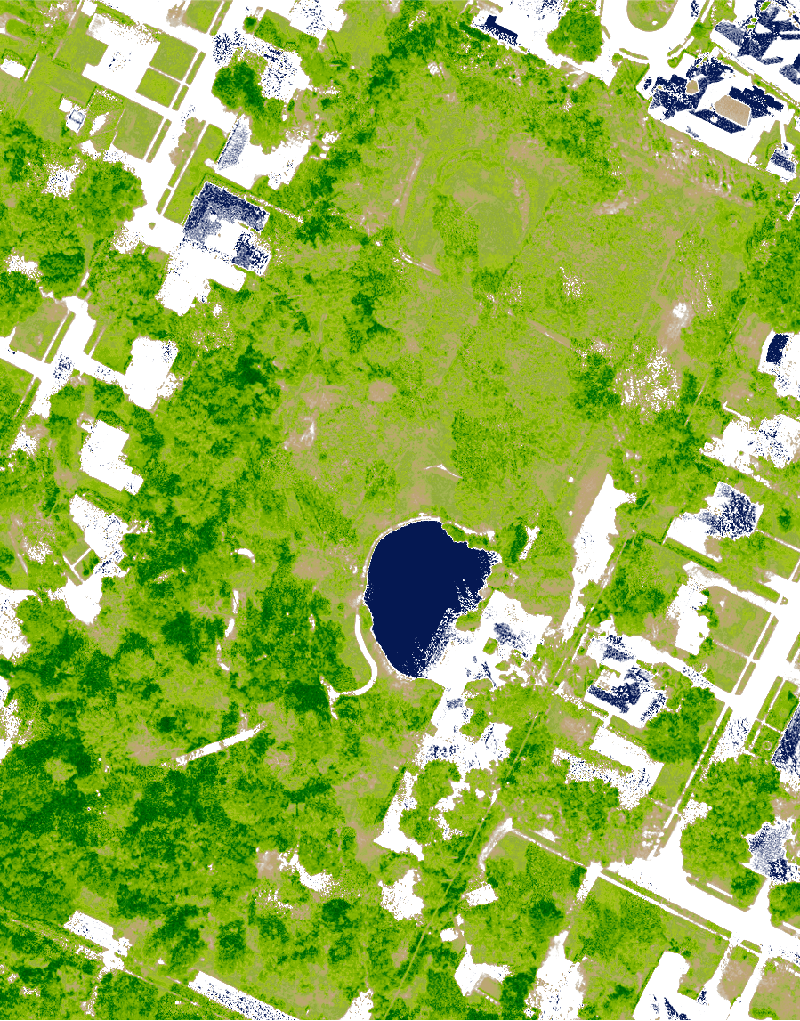
tools.i_vi(output="ndvi", viname="ndvi", red="imagery.1", nir="imagery.4")

# Visualize index
m = gj.Map(width=800)
m.d_rast(map="ndvi")
m.show()
Normalized Difference Water Index
Normalized Difference Water Index (NDWI)
NDWI = (green - NIR) / (green + NIR)
# Calculate Normalized Difference Water Index
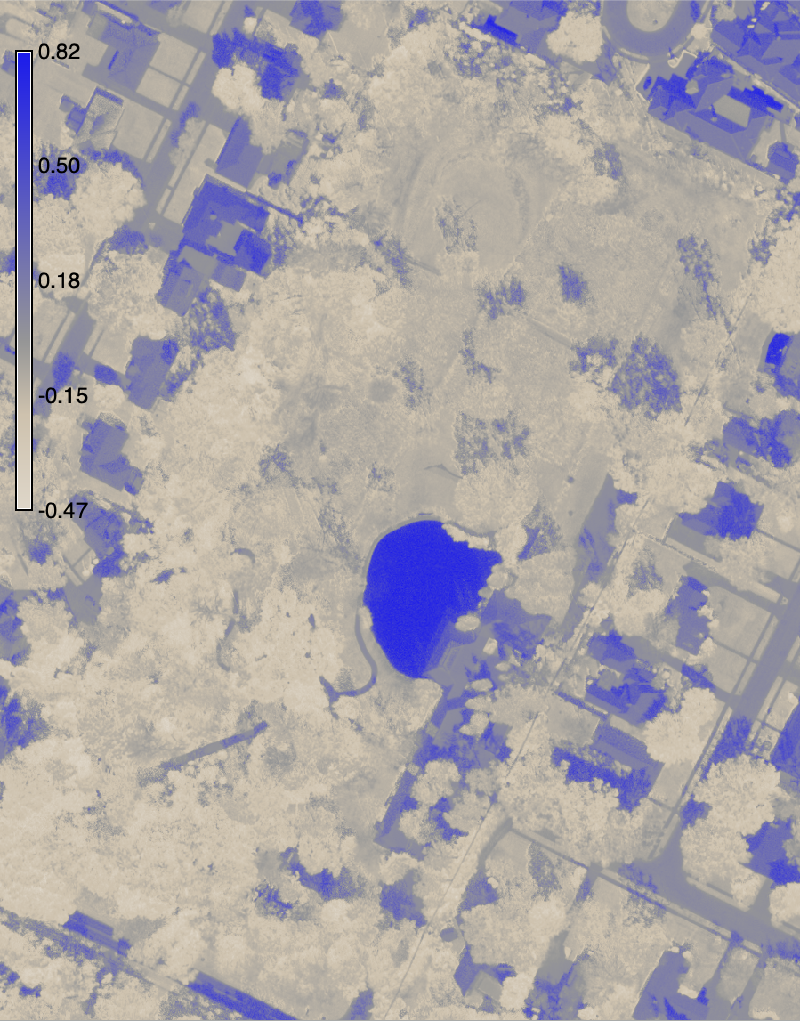
tools.i_vi(output="ndwi", viname="ndwi", green="imagery.2", nir="imagery.4")

# Visualize index
m = gj.Map(width=800)
m.d_rast(map="ndwi")
m.d_legend(raster="ndwi", at=(50, 95, 2, 4))
m.show()
Fuzzy clumping
# Extract upper range
tools.r_mapcalc(expression="filter = if(ndwi > 0.45, ndwi, null())")

# Fuzzy clumping
tools.r_clump(input="filter", output="clumps", threshold=0.1, minsize=2000)

# Sort clumps
tools.r_report(map="clumps", units="cells", sort="des", format="plain")

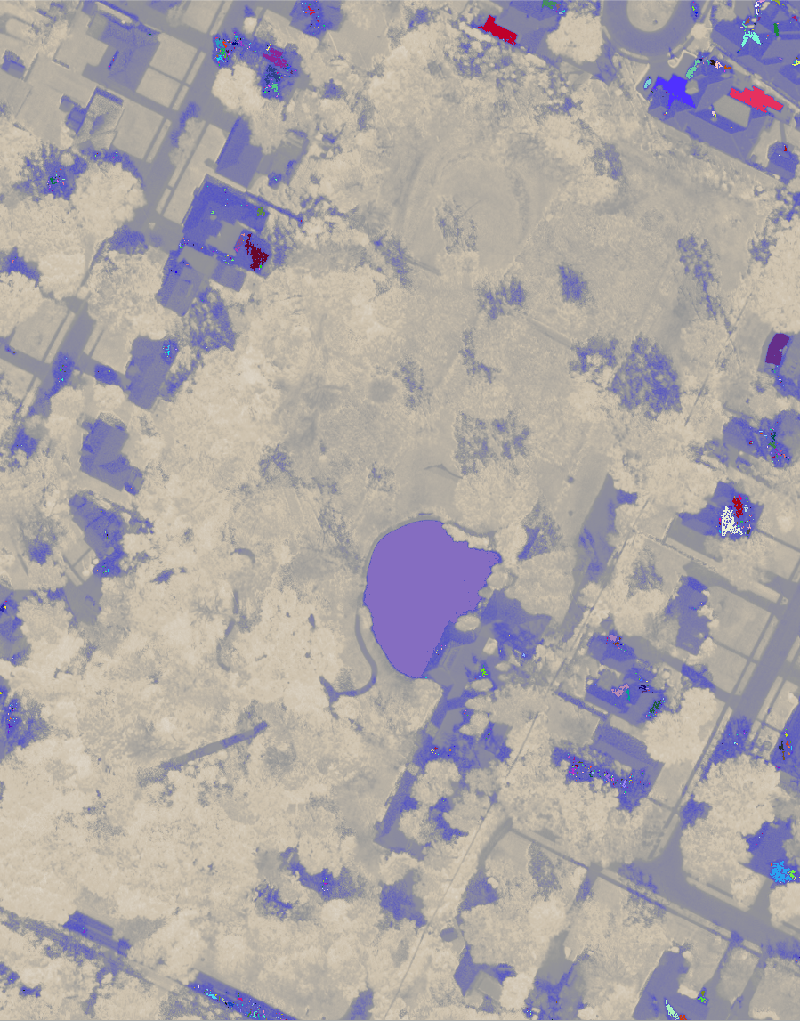
# Visualize clumps
m = gj.Map(width=800)
m.d_rast(map="ndwi")
m.d_rast(map="clumps")
m.show()
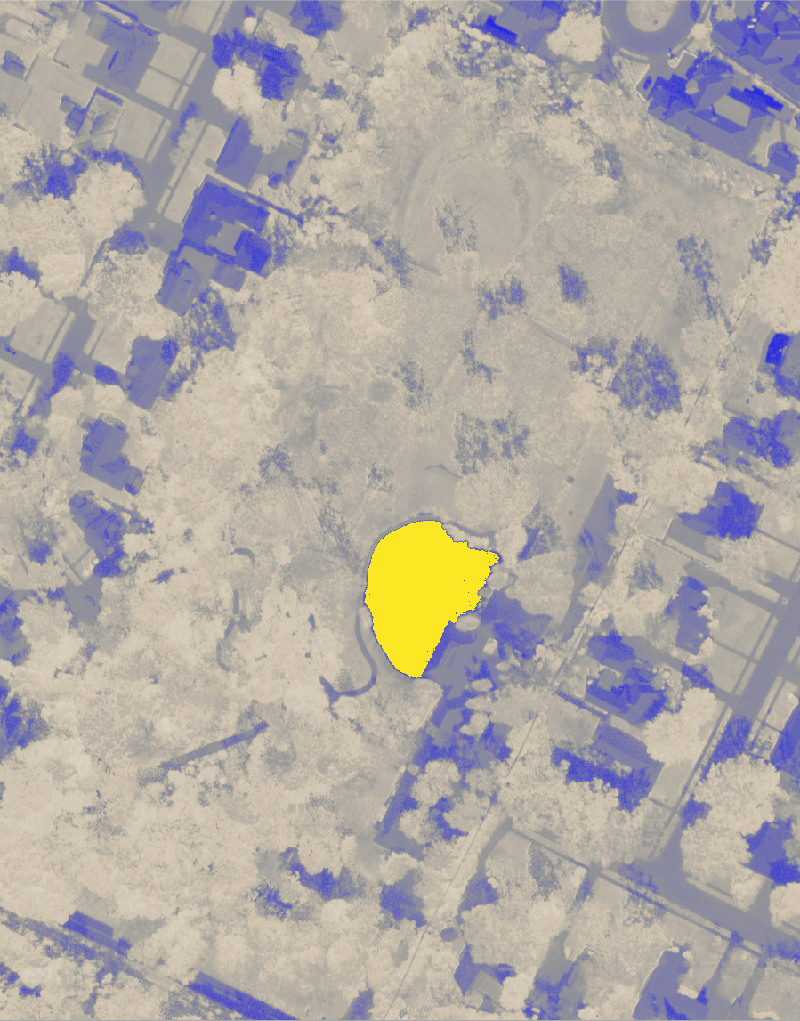
Vectorize lake
# Vectorize
tools.r_to_vect(input="lake", output="lake", type="area")

# Clean
tools.v_clean(input="lake", output="cleaned", type="point,line,area", tool="rmarea", thres=100)

# Generalize
tools.v_generalize(input="cleaned", output="lake", type="area", method="snakes", threshold=2, alpha=1, beta=1 )

# Remove intermediate map
tools.g_remove(type="vector", name="cleaned", flags="f")

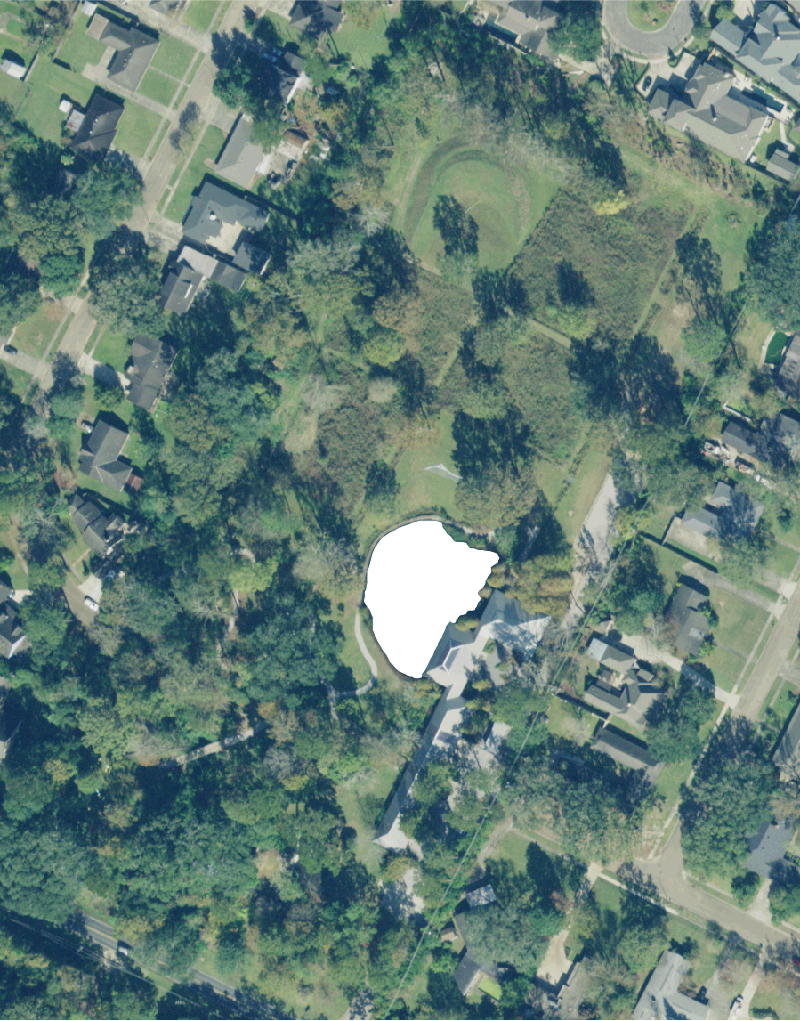
# Visualize imagery
m = gj.Map(width=800)
m.d_rast(map="imagery")
m.d_vect(map="lake", color="white", fill="white")
m.show()