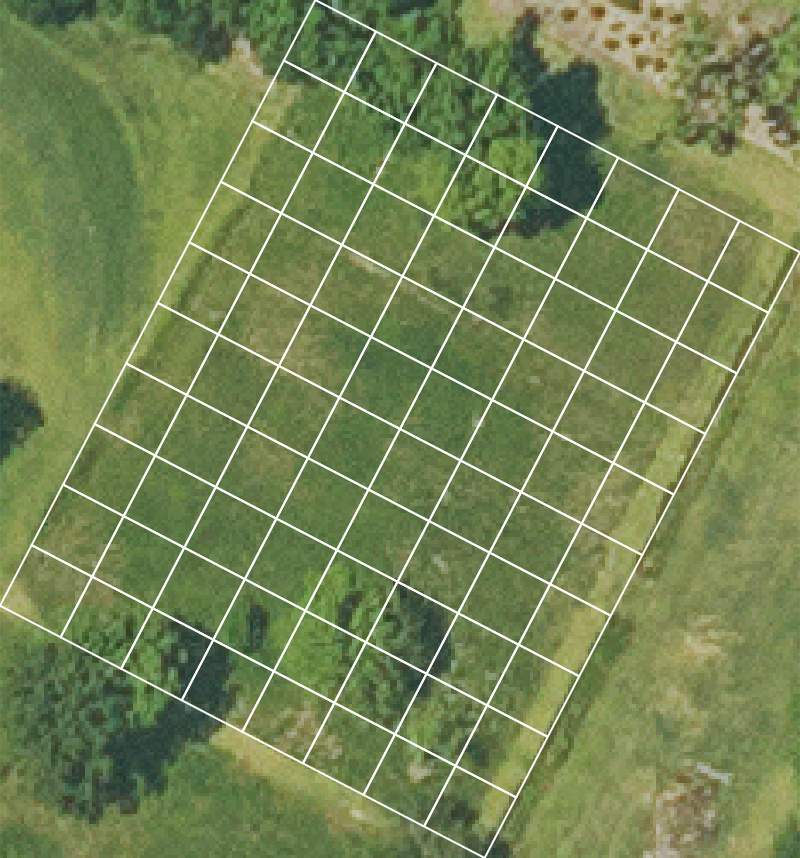
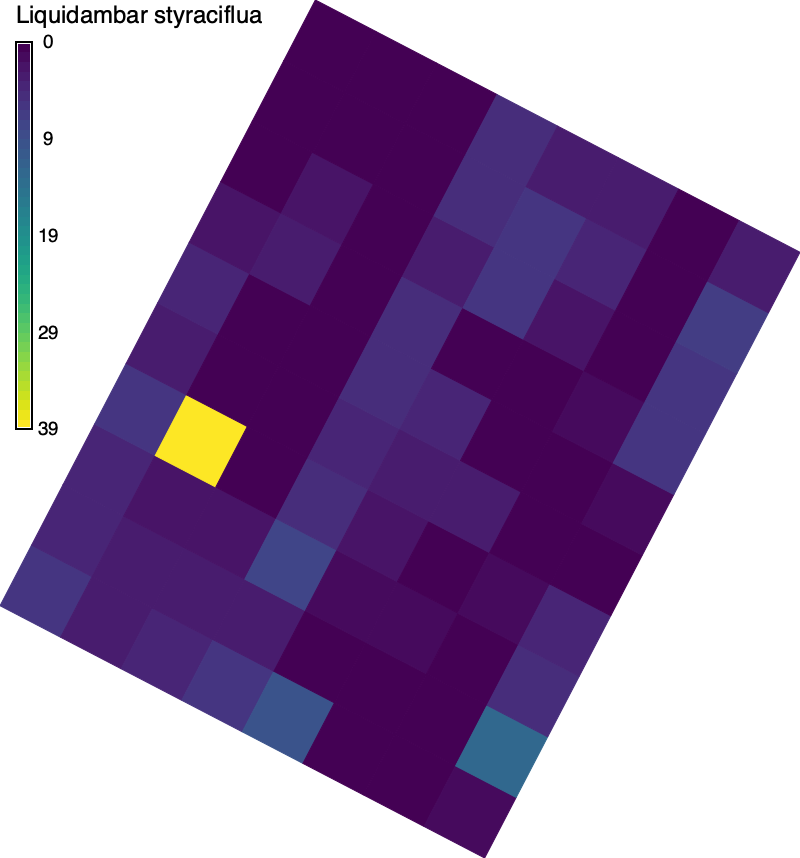
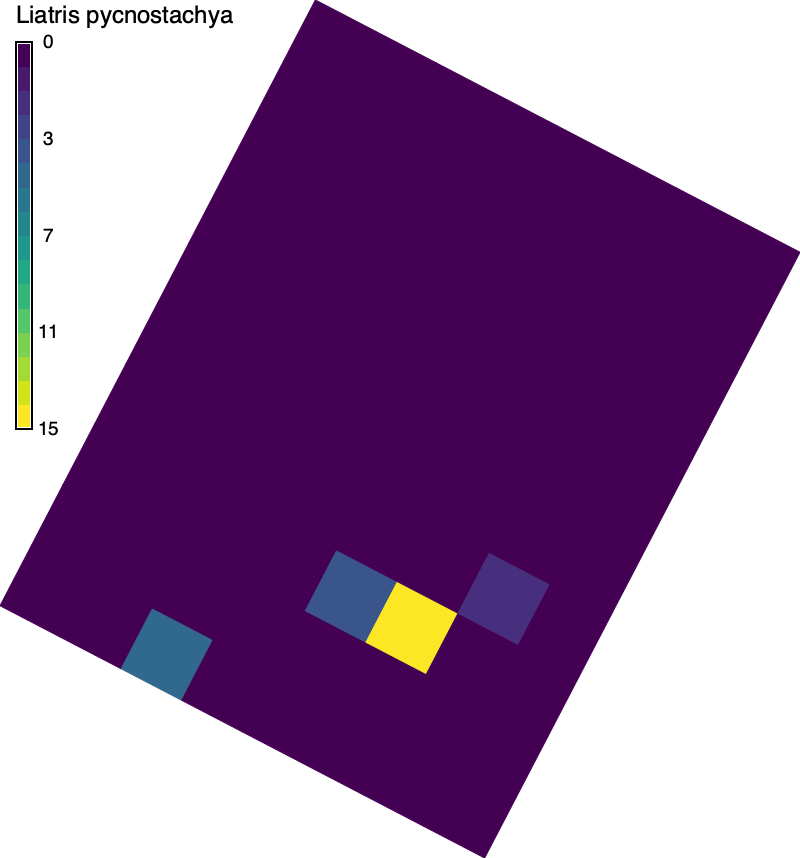
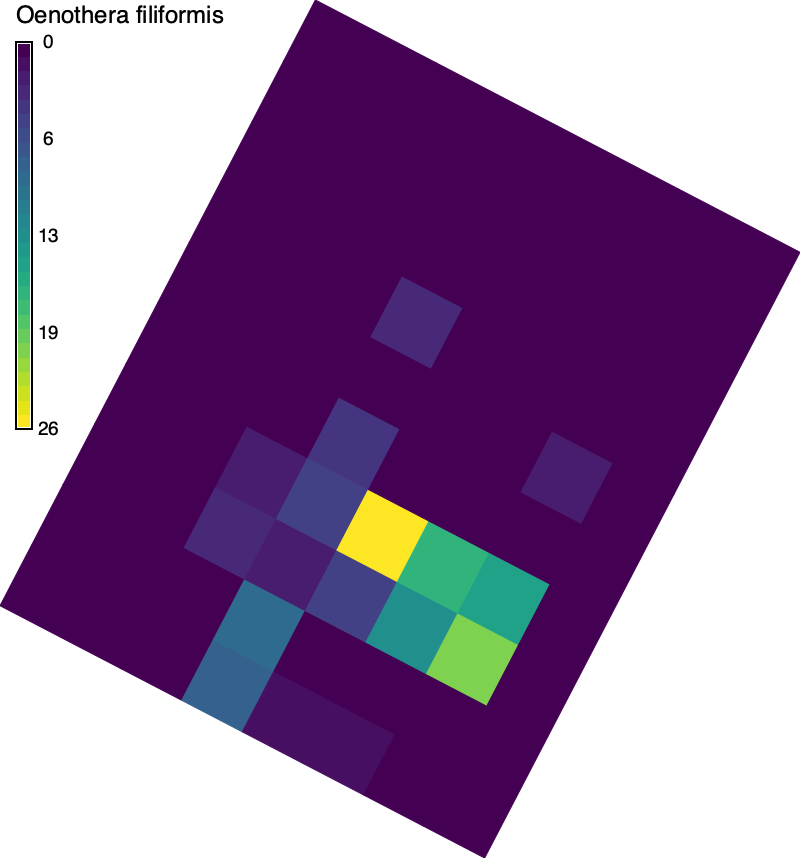
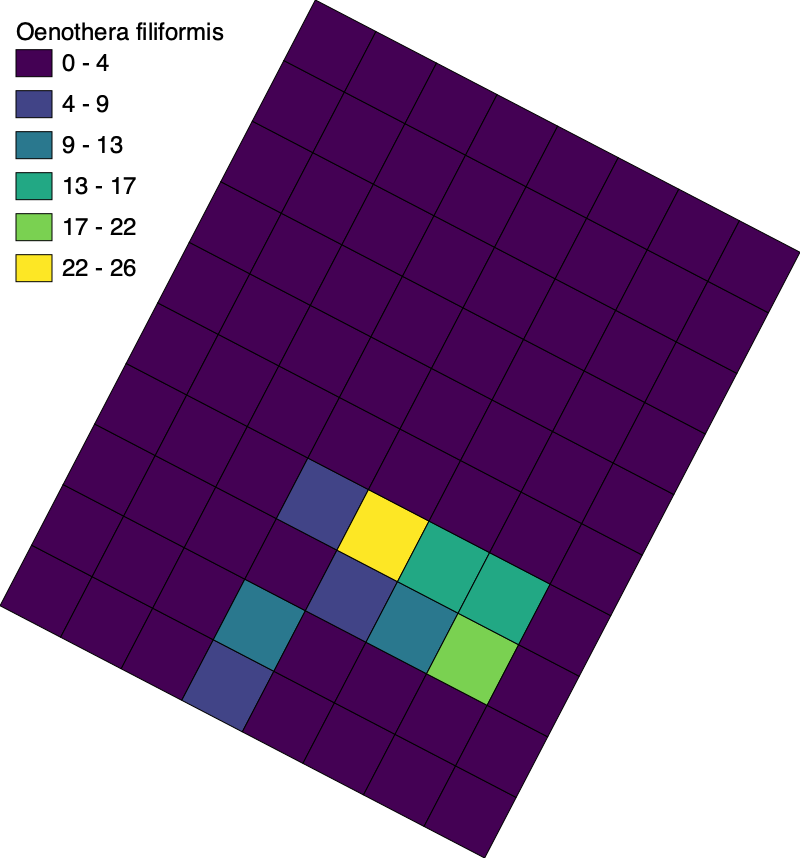
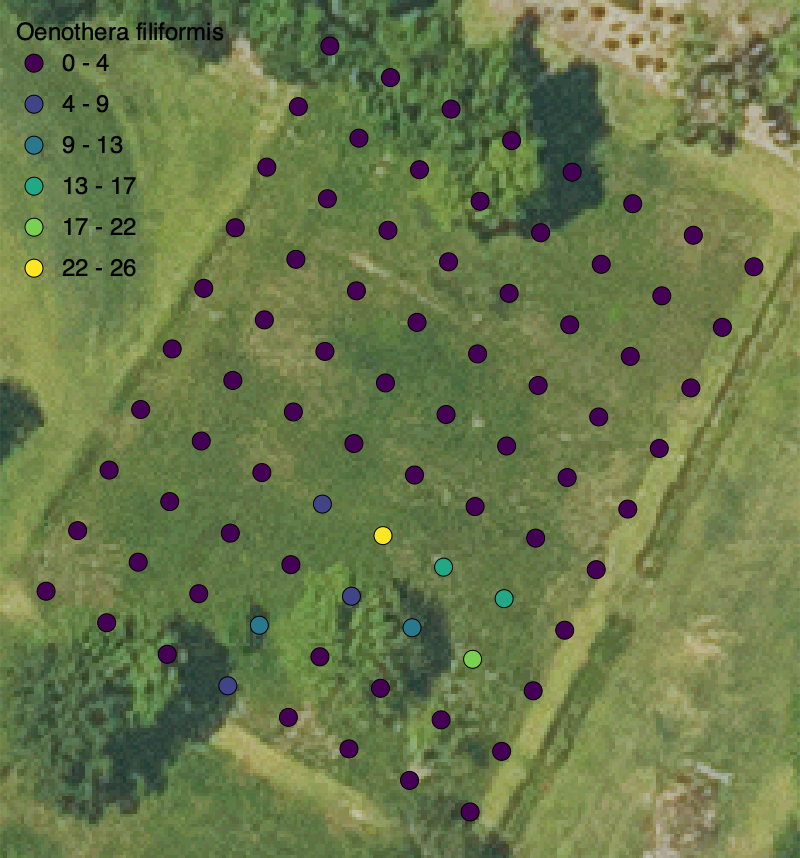
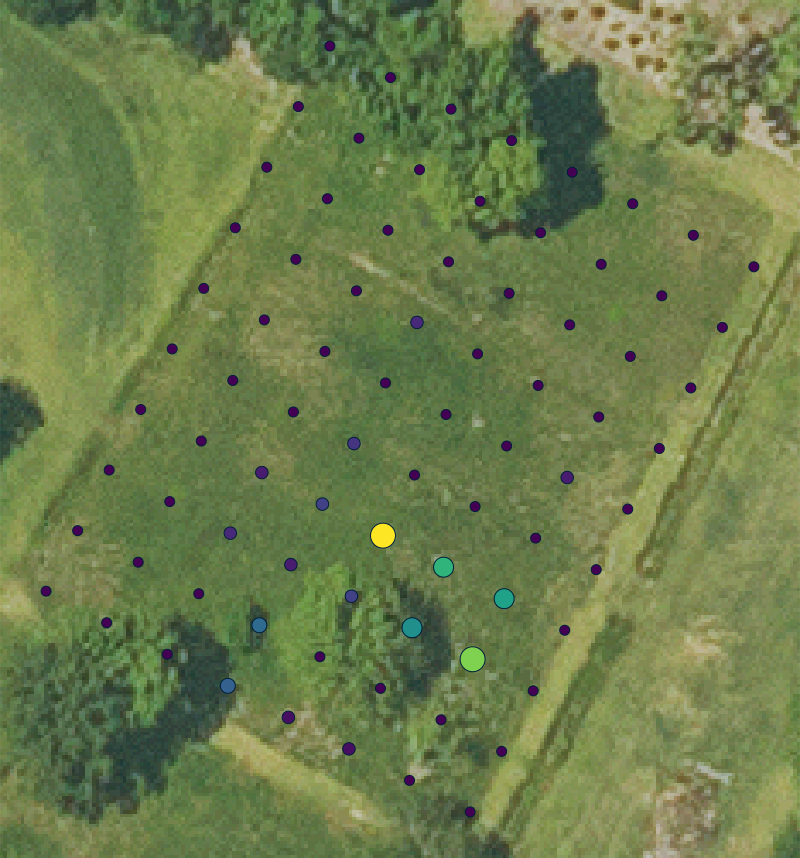
Mapping the distribution of Liquidambar styraciflua, Liatris pycnostachya, and Oenothera filiformis in the fourth quadrant of the meadow at the LSU Hilltop Arboretum. Download the project and table to get started.
Setup
# Import modules import sysimport subprocessfrom pathlib import Pathfrom contextlib import suppress# Find GRASS Python packages "grass" , "--config" , "python_path" ],= True # Import GRASS packages import grass.script as gsimport grass.jupyter as gjfrom grass.tools import Tools# Create and initialize GRASS project try :"hilltop" )except ValueError :with suppress(ValueError ):"hilltop" , epsg= "2801" )"hilltop" )= Tools(overwrite= True )# Print projection = tools.g_proj(format = "shell" , flags= "p" ).keyvalprint (projection.get("name" ))
NAD83(HARN) / Louisiana South
Region
# Set region = 206040 , s= 205640 , e= 1023700 , w= 1022100 , res= 0.3 )= "hilltop" )
Census grid
# Set corner coordinate = "1022943, 205903" # Create grid map = "grid" , grid= (10 ,8 ), position= "coor" , coordinates= coordinates, box= (6 ,6 ), angle=- 27.5 , type = "area" )# Set region = "grid" )# Visualize imagery = gj.Map(width= 800 , use_region= True )map = "imagery" )map = "grid" , color= "white" , fill= "none" , width= 2 )
# Explore = gj.InteractiveMap(= 600 ,= 600 ,= "OpenStreetMap.Mapnik" ,= True "grid" )
Census data
# Assign IDs map = "grid" , column= "col" , qcol= "9 - col" )map = "grid" , column= "row" , qcol= "11 - row" )map = "grid" , columns= "id VARCHAR(10)" )map = "grid" , column= "id" , query= "row || CHAR(64 + col)" )# Set path to table = Path.cwd() / "data" / "census.csv" # Import data input = data, output= "census" , overwrite= True )# Make columns numeric = "ALTER TABLE grid ADD COLUMN ls INTEGER" )= "ALTER TABLE grid ADD COLUMN lp INTEGER" )= "ALTER TABLE grid ADD COLUMN of INTEGER" )# Join tables map = "grid" ,= "id" ,= "census" ,= "ID" ,= ("ls" , "lp" , "of" )# Export vector input = "grid" , output= "census.gpkg" , format = "GPKG" )
Liquidambar styraciflua
# Rasterize input = "grid" ,= "liquidambar_styraciflua" ,= "attr" ,= "ls" # Assign colors map = "grid" , use= "attr" , column= "ls" , color= "viridis" )# Visualize = gj.Map(width= 800 , use_region= True )map = "grid" )= "liquidambar_styraciflua" ,= "black" ,= "Liquidambar styraciflua" ,= 24 ,= (50 , 95 , 2 , 4 ),= "s" # Save image "liquidambar-styraciflua.png" )# Export raster input = "grid" ,= "liquidambar-styraciflua.tif" ,format = "GTiff"
Liatris pycnostachya
# Rasterize input = "grid" ,= "liatris_pycnostachya" ,= "attr" ,= "lp" # Assign colors map = "grid" , use= "attr" , column= "lp" , color= "viridis" )# Visualize = gj.Map(width= 800 , use_region= True )map = "grid" )= "liatris_pycnostachya" ,= "black" ,= "Liatris pycnostachya" ,= 24 ,= (50 , 95 , 2 , 4 ),= "s" # Save image "liatris-pycnostachya.png" )# Export raster input = "grid" ,= "liatris-pycnostachya.tif" ,format = "GTiff"
Color gradient
# Import libraries import numpy as npimport matplotlib.cm as cmimport cmcrameri.cm as cmcimport cmasher as cmr# # Set color map # library = cmc # colormap = "managua" # gradient = getattr(library, colormap) # Set color map = cm= "viridis" = getattr (library, colormap)# Set number of classes = 6 # Generate color gradient = gradient(np.linspace(0 , 1 , n))= np.round (gradient[:, :3 ] * 255 ).astype(int )= [f" { r} : { g} : { b} " for r, g, b in gradient]
Thematic map
Tutorial: Thematic Maps
# Visualize = gj.Map(width= 800 , use_region= True )map = "grid" ,= "of" ,= "Oenothera filiformis" ,= "int" ,= n,= gradient= 48 ,= 24 ,= 36 ,= (2 , 98 )
Thematic dot map
# Extract centroids input = "grid" , output= "centroids" , type = "centroid" )input = "centroids" , output= "points" , from_type= "centroid" , to_type= "point" )# Visualize = gj.Map(width= 800 , use_region= True )map = "imagery" )map = "points" ,= "of" ,= "Oenothera filiformis" ,= "int" ,= n,= gradient,= "basic/point" ,= 36 ,= 48 ,= 24 ,= 36 ,= (2 , 98 )
Proportional dot map
# Extract centroids input = "grid" , output= "centroids" , type = "centroid" )input = "centroids" , output= "points" , from_type= "centroid" , to_type= "point" )# Set specimen = "of" # Set colors map = "points" , use= "attr" , column= f" { specimen} " , color= "viridis" )# Visualize = gj.Map(width= 800 , use_region= True )map = "imagery" )map = "points" , size= 20 , icon= "basic/point" , where= f" { specimen} =0 OR { specimen} IS NULL" )map = "points" , size= 25 , icon= "basic/point" , where= f" { specimen} > 0 AND { specimen} <= 5" )map = "points" , size= 30 , icon= "basic/point" , where= f" { specimen} > 5 AND { specimen} <= 10" )map = "points" , size= 40 , icon= "basic/point" , where= f" { specimen} > 10 AND { specimen} <= 20" )map = "points" , size= 50 , icon= "basic/point" , where= f" { specimen} > 20 AND { specimen} <= 30" )map = "points" , size= 60 , icon= "basic/point" , where= f" { specimen} > 30" )