An Introduction to Grasshopper
Modeling points, lines, curves, and surfaces in Grasshopper
Contents
Visual Programming with Grasshopper
Grasshopper is a visual programming interface for the 3D modeling program Rhinoceros. Rhino uses non-uniform rational B-splines (NURBS) to precisely, mathematically model geometry. With visual programming, you can algorithmically generate geometry by composing diagrams that link data to functions. An algorithmic approach enables designers to create complex forms and rapidly generate alternative designs. Resources for learning more about Grasshopper include:
- The Grasshopper Primer
- Grasshopper Basics with David Rutten
- Grasshopper Docs
- TU Delft Grasshopper Tutorials
This tutorial is an introduction to modeling basic geometry -
such as points, line, polylines, curves, and surfaces - in Grasshopper.
Download the Grasshopper definition
for this tutorial as a guide.
First start Rhino.
Type grasshopper in the Rhino’s command line
to launch the visual programming interface.
The Grasshopper interface has a menu bar,
a toolbar with parameters and components,
and a canvas for composing diagrams.
Parameters are used to set and store data.
Components are functions for performing operations.
Drop parameters and components on the canvas
and connect them together with wires
to create node based diagrams
that generate geometry in Rhino.
A visual programming diagram composed in Grasshopper
generates geometry in Rhino.
Points
In Cartesian space a point is defined by x, y, and z coordinates. In Grasshopper points can either be constructed from x, y, and z coordinates or drawn in Rhino and referenced in Grasshopper.
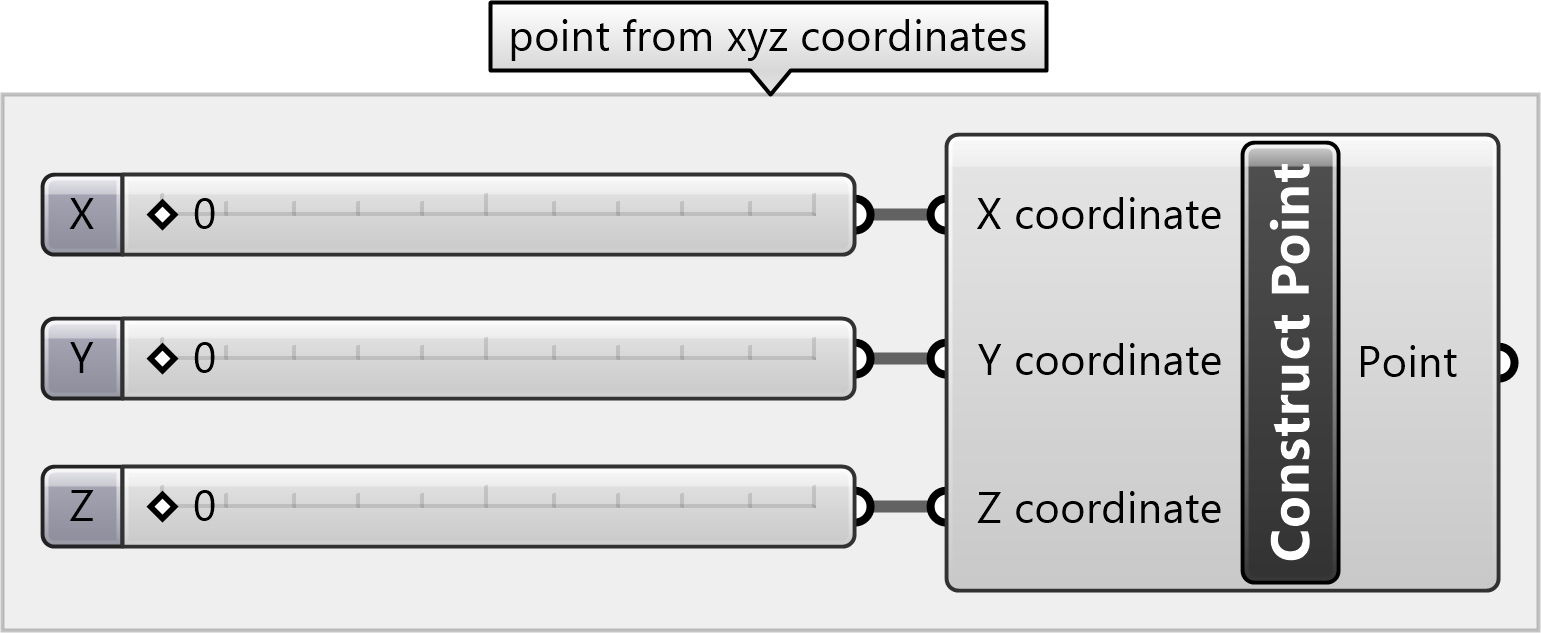
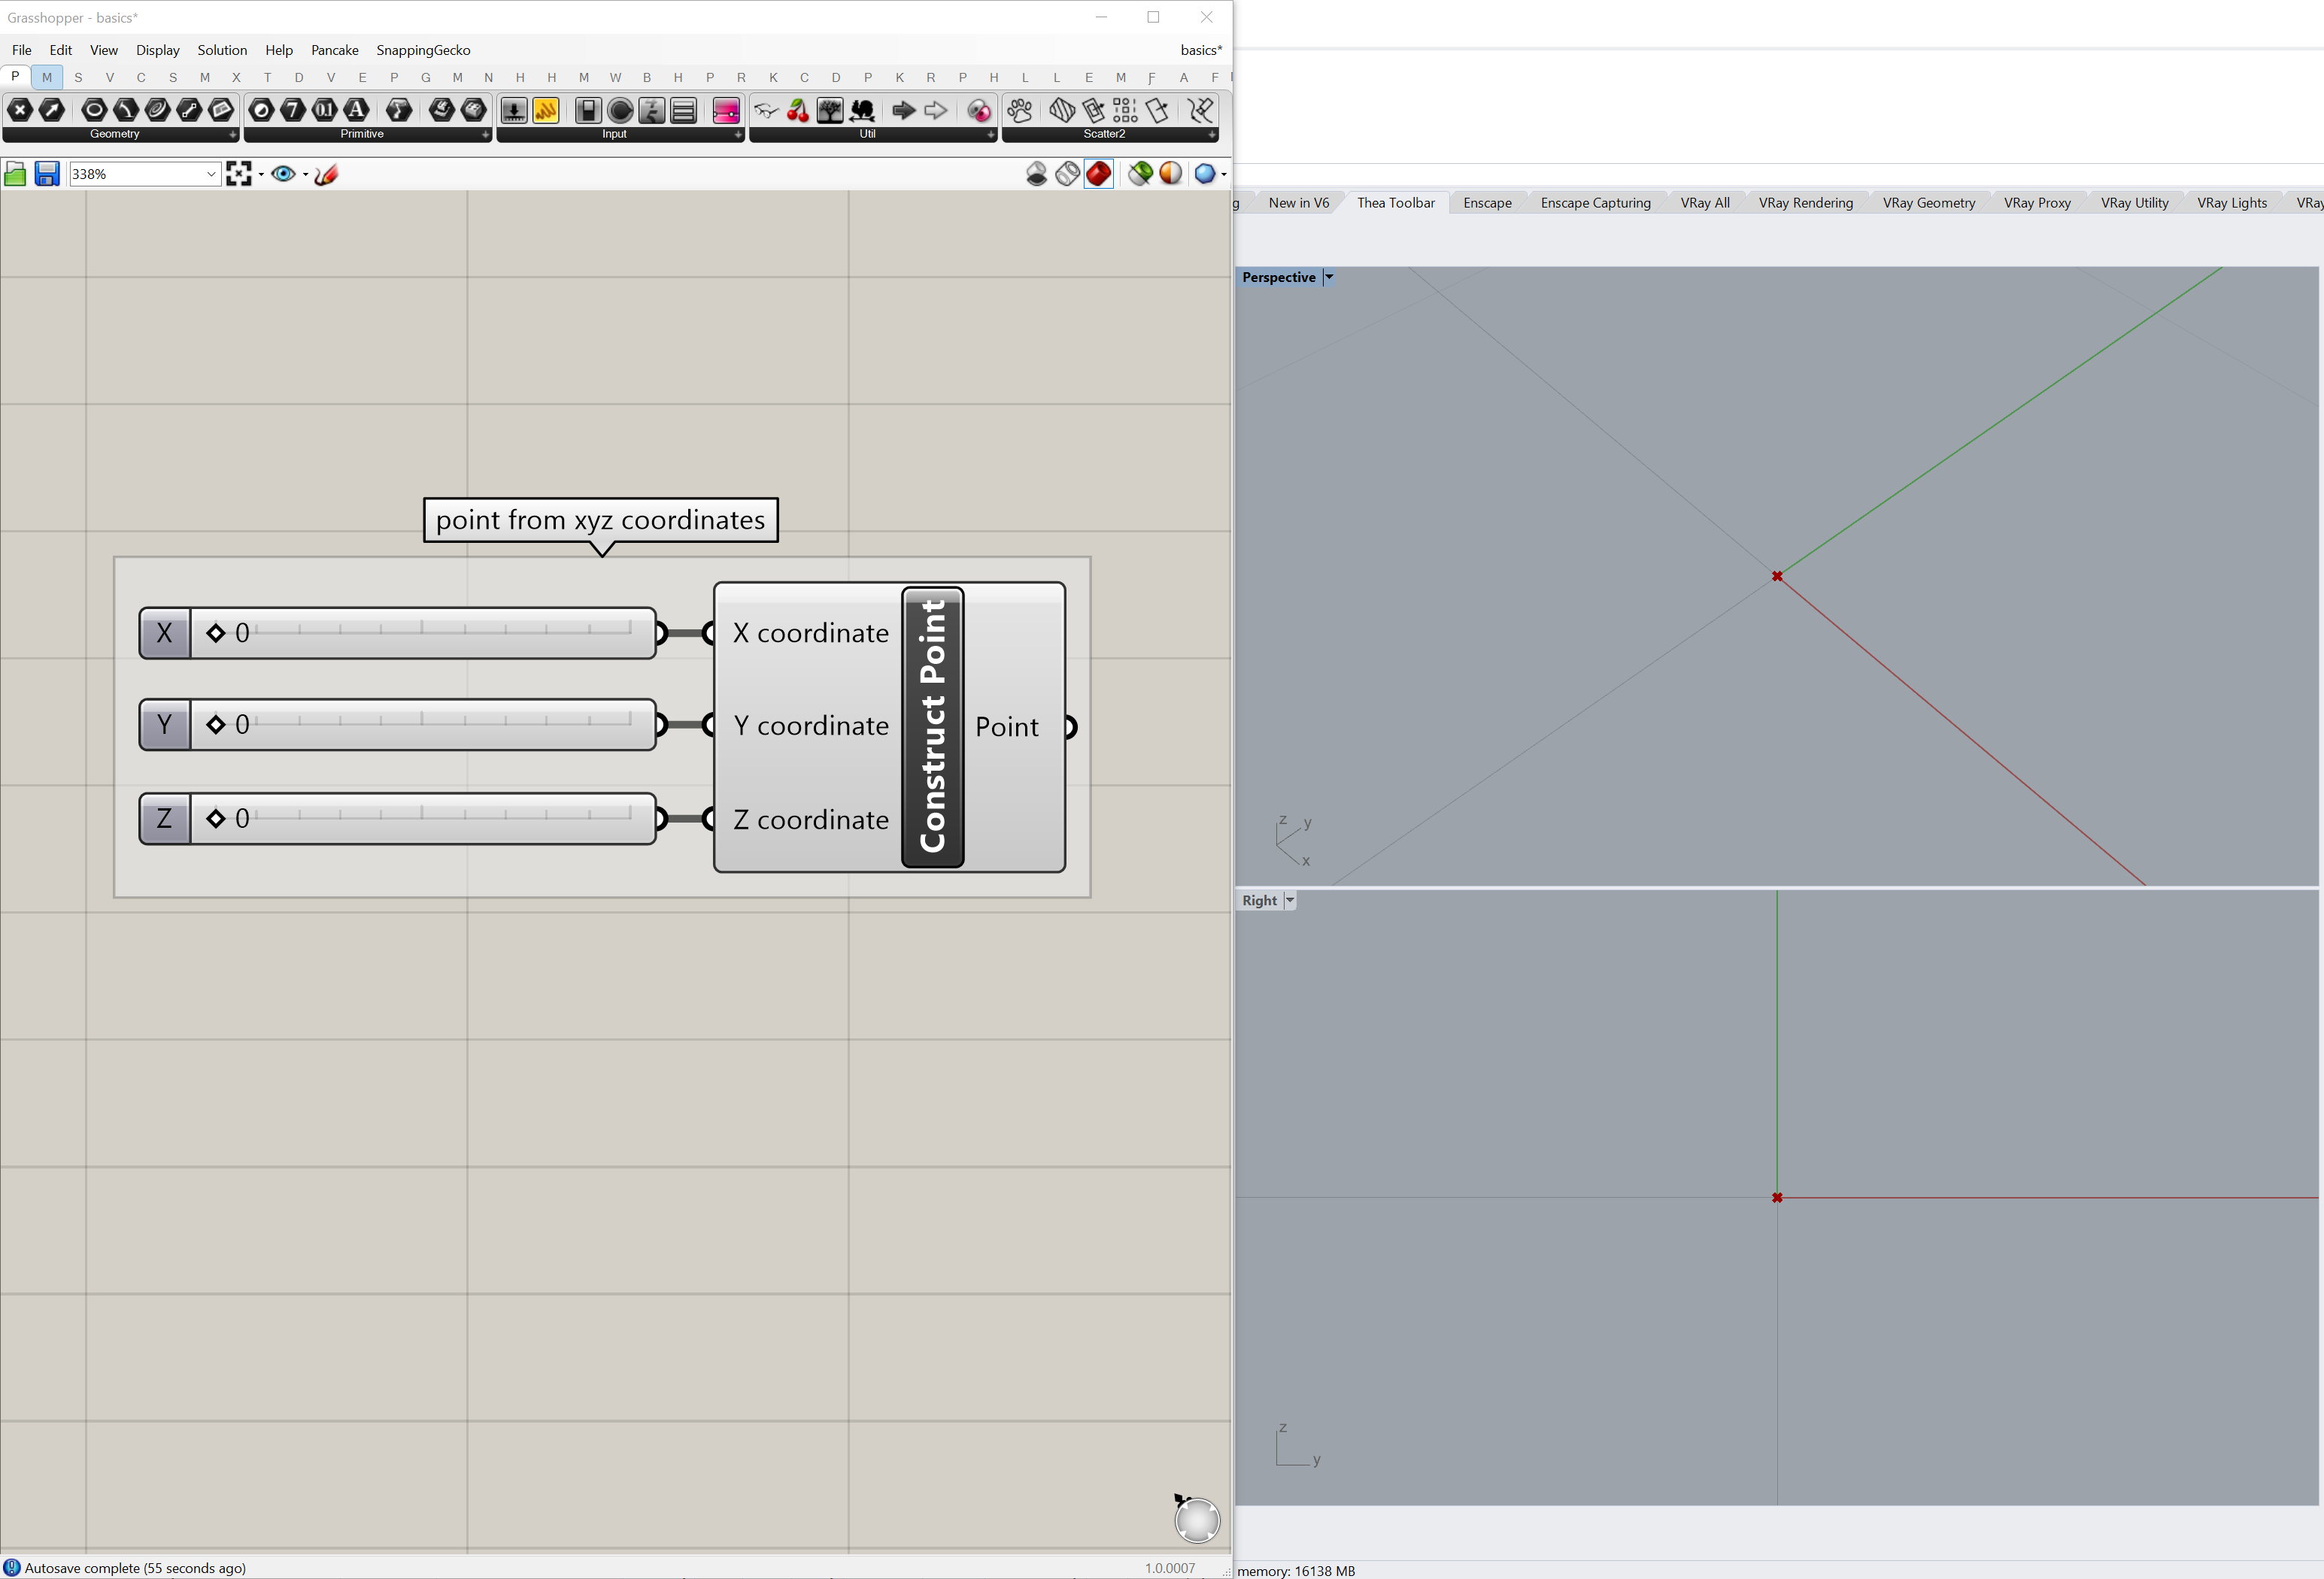
One way to define a point is with the
Construct Point
component.
Find the Construct Point component
in the Points panel of the Vector tab.
Drop this component on the canvas.
Then add input data for the x, y, and z parameters
using Number Slider parameters.
Find the Number Slider parameters
in the Input panel of the Params tab.
Or double click on the canvas to search for a component
and then type in either number slider or a value for the slider such as 10.
Connect wires from each of the output nodes
on the right side of the number sliders
to the respective input node on the left of the Construct Point component.
Drag the handle on each slider to a set x, y, and z values for the point.
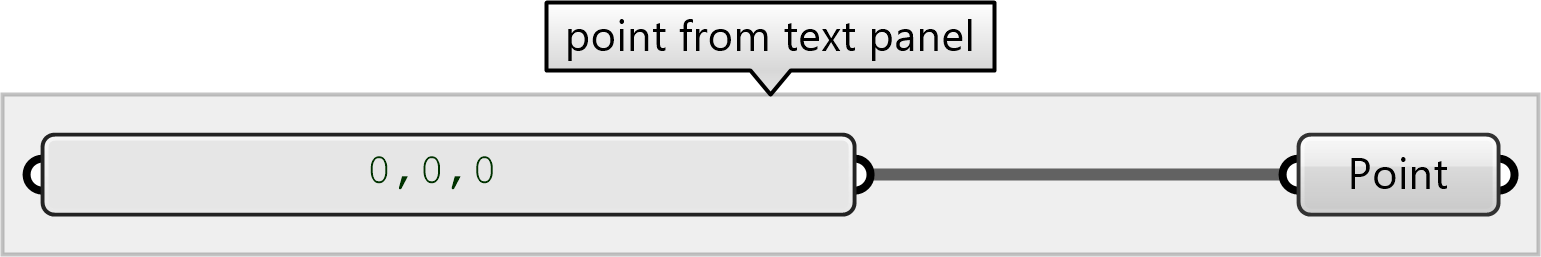
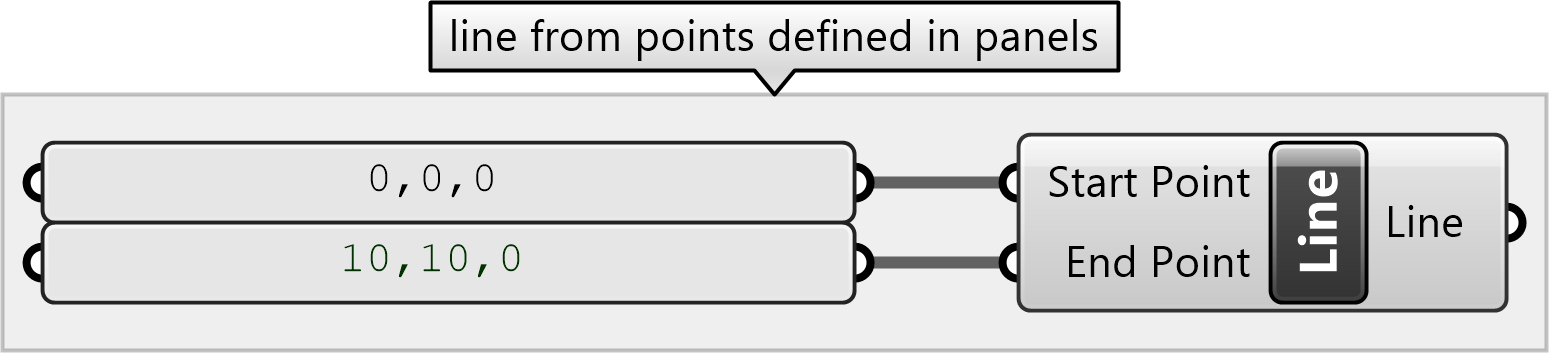
Points can also be defined by text panels with x, y, and z values.
Place a Point parameter
from the Input panel of the Params tab on the canvas.
Then place a Panel parameter from Input panel.
Double click on the panel to edit it.
Type in x, y, and z values separated by commas.
Connect the Panel to the Point parameter.
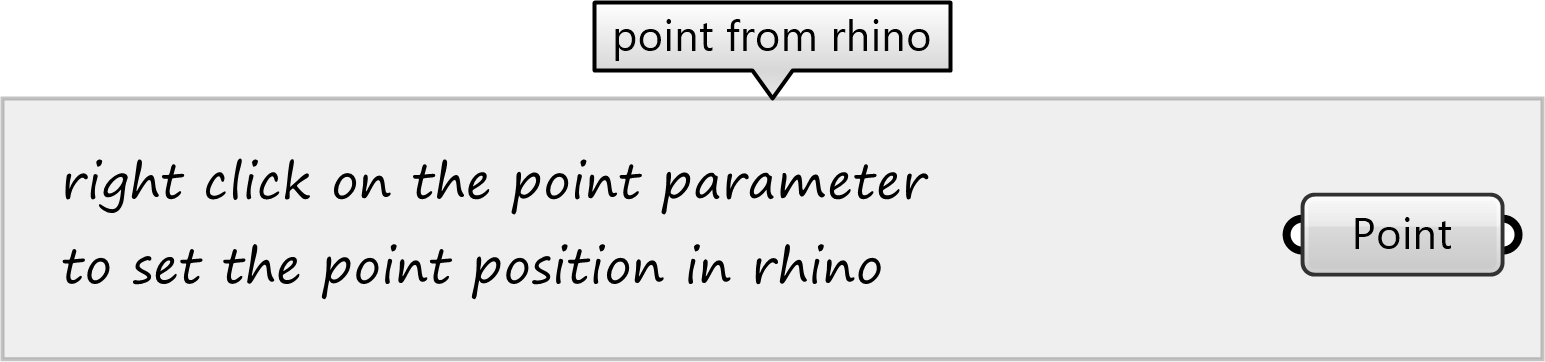
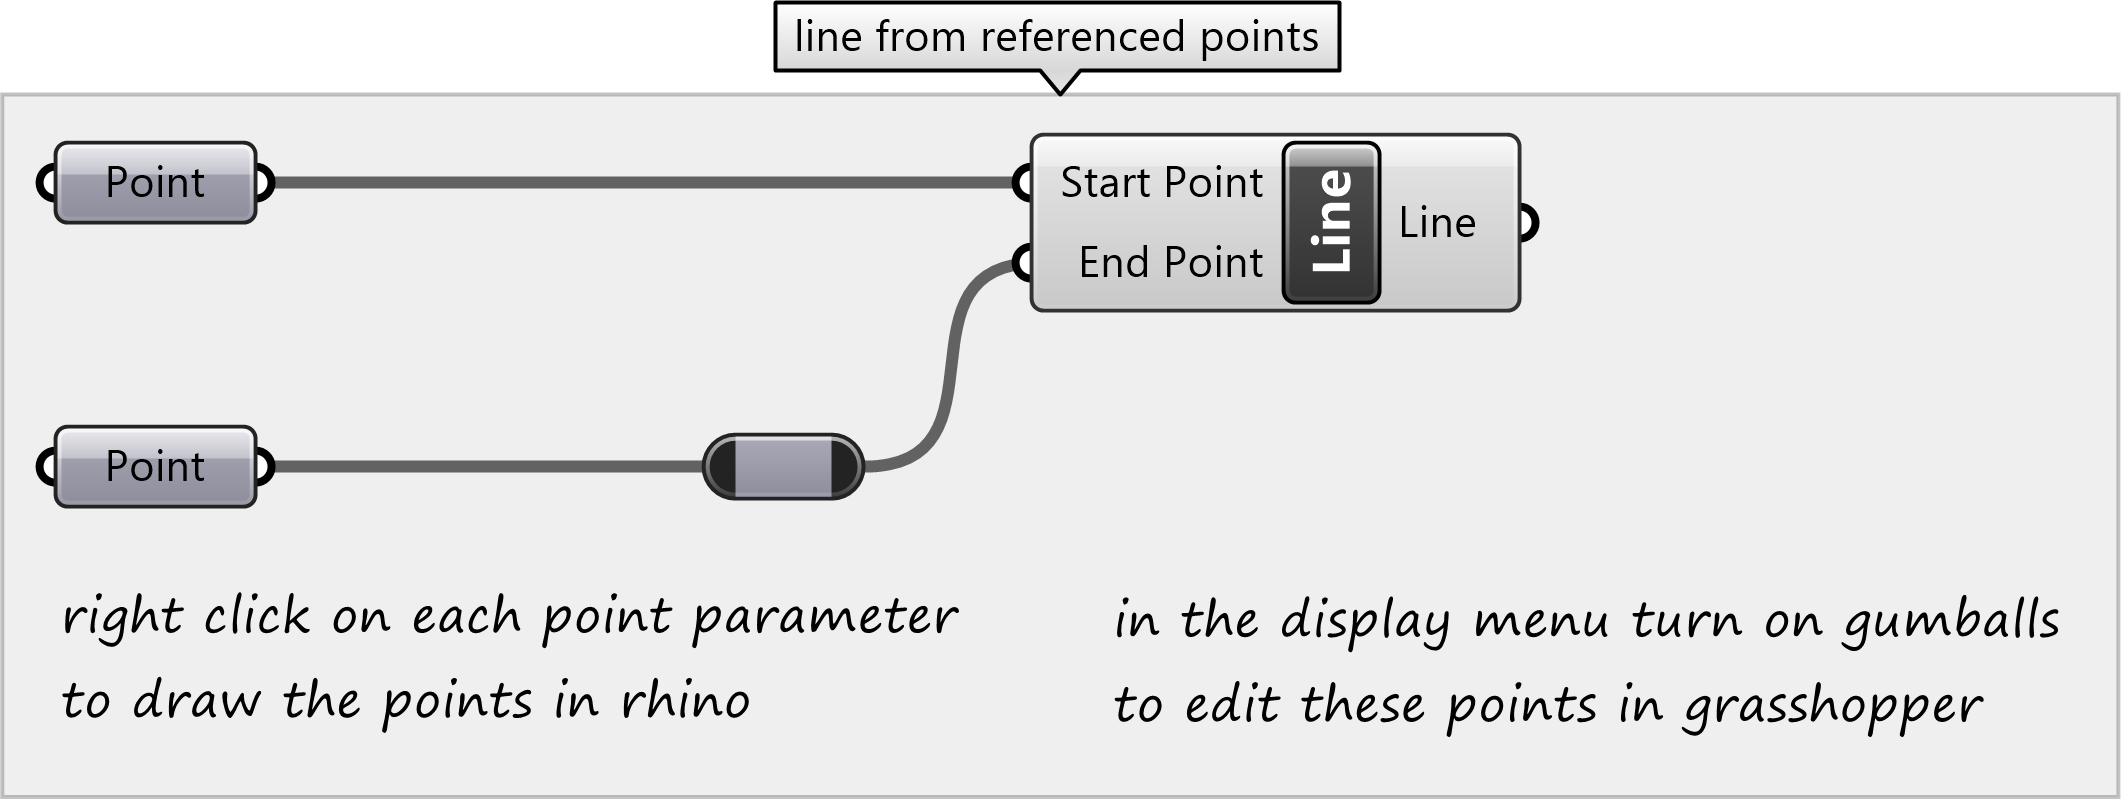
The Point parameter can also be set
to a point drawn in Rhino.
Right click on the Point parameter
and select set one point.
Grasshopper will minimize
and the command line in Rhino will ask for a point location.
Either draw a point in one of the Rhino viewports
or type x, y, and z values separated by commas into the command line.
Lines
In Grasshopper lines can be defined by start and end points
by a start point, direction, and length,
or by drawing a line in Rhino.
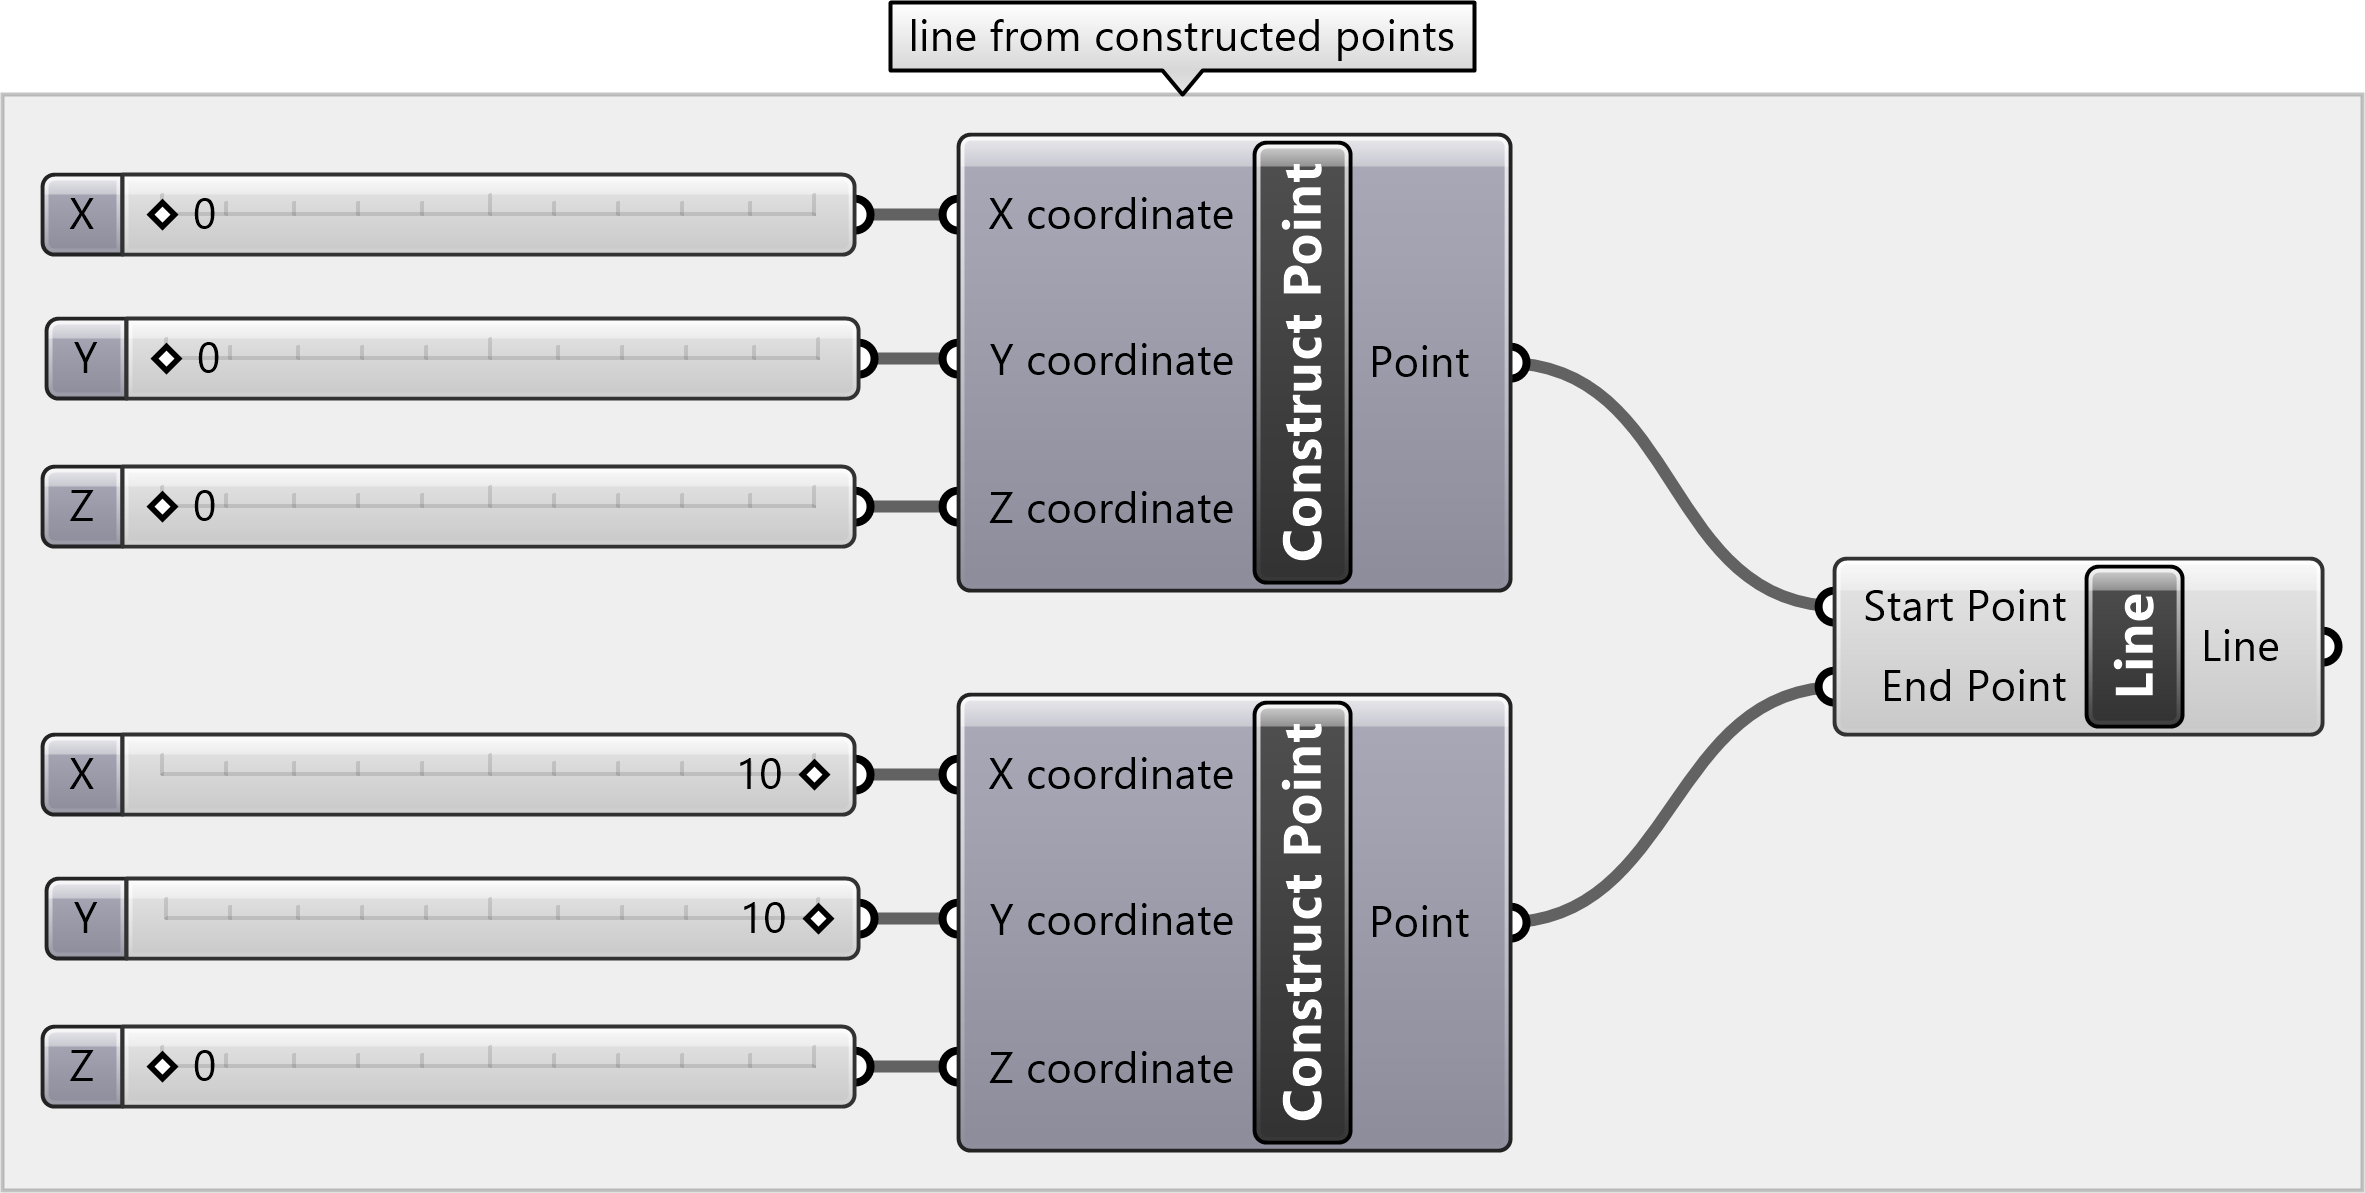
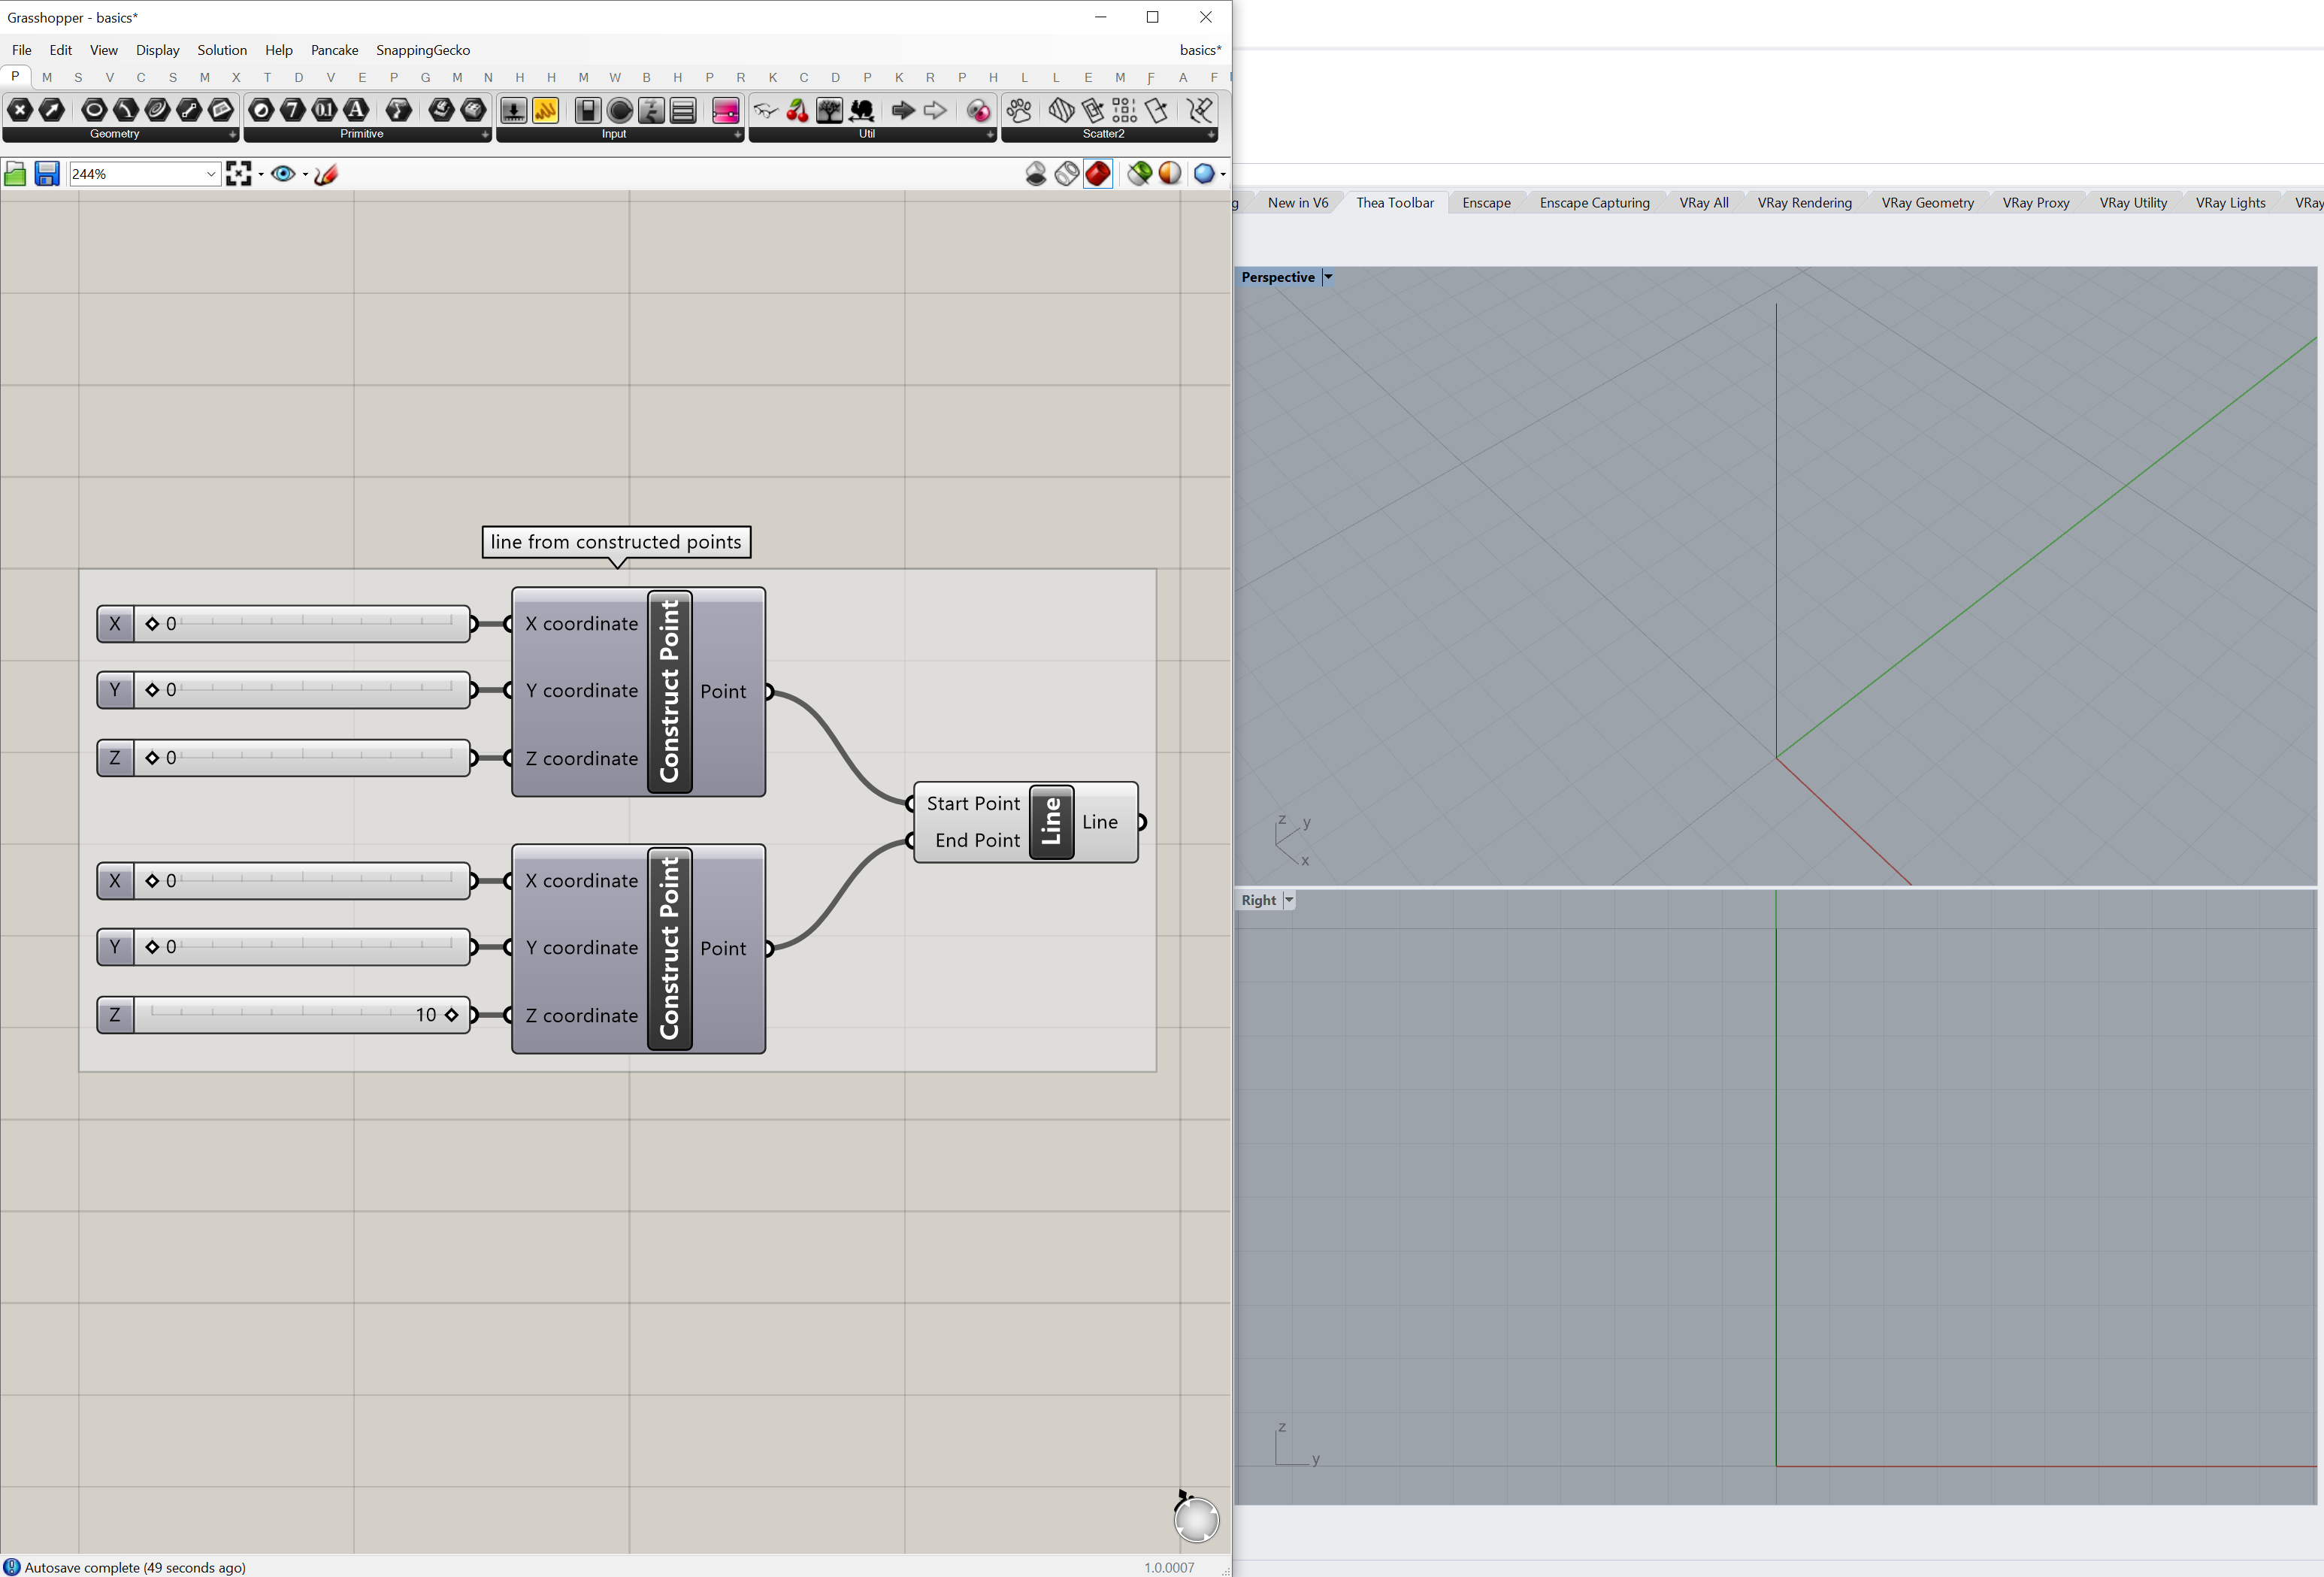
Start and end points can set by
constructing points from sliders,
by defining coordinate in panels,
or by drawing points in Rhino.
Place a
Line
component from the Input panel of the Params tab on the canvas.
Then connect the output for start and end points -
whether from Number Slider, Point, or Panel parameters -
to the respective input parameters on the Line component.
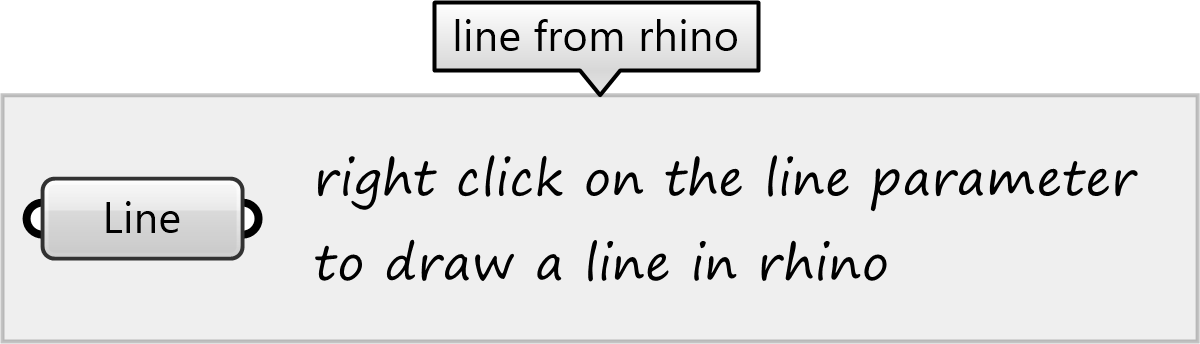
To reference a line drawn in Rhino,
place a Line parameter.
Right click on the Line parameter and select set one line.
Grasshopper will minimize and the Rhino command line will ask for
the starting point and then ending point of the line.
Either draw the points in a Rhino viewport or
enter the coordinates in the command line.
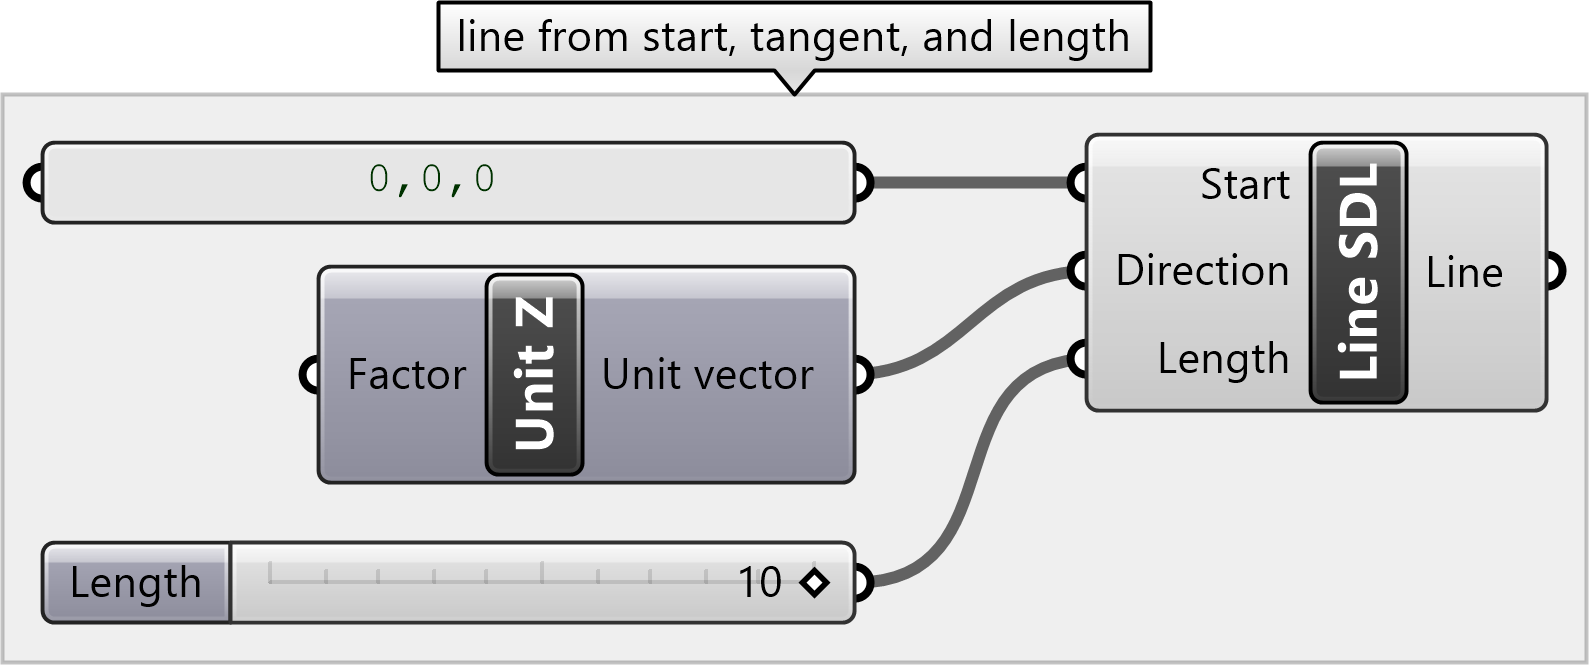
To draw a line from a starting point, length, and distance,
first place the
Line SDL
component.
Set a start point with Point parameter, Panel, or
Construct Point component.
Set a direction with a vector component such as
Unit Z.
Set a length using a Number Slider or Panel parameter.
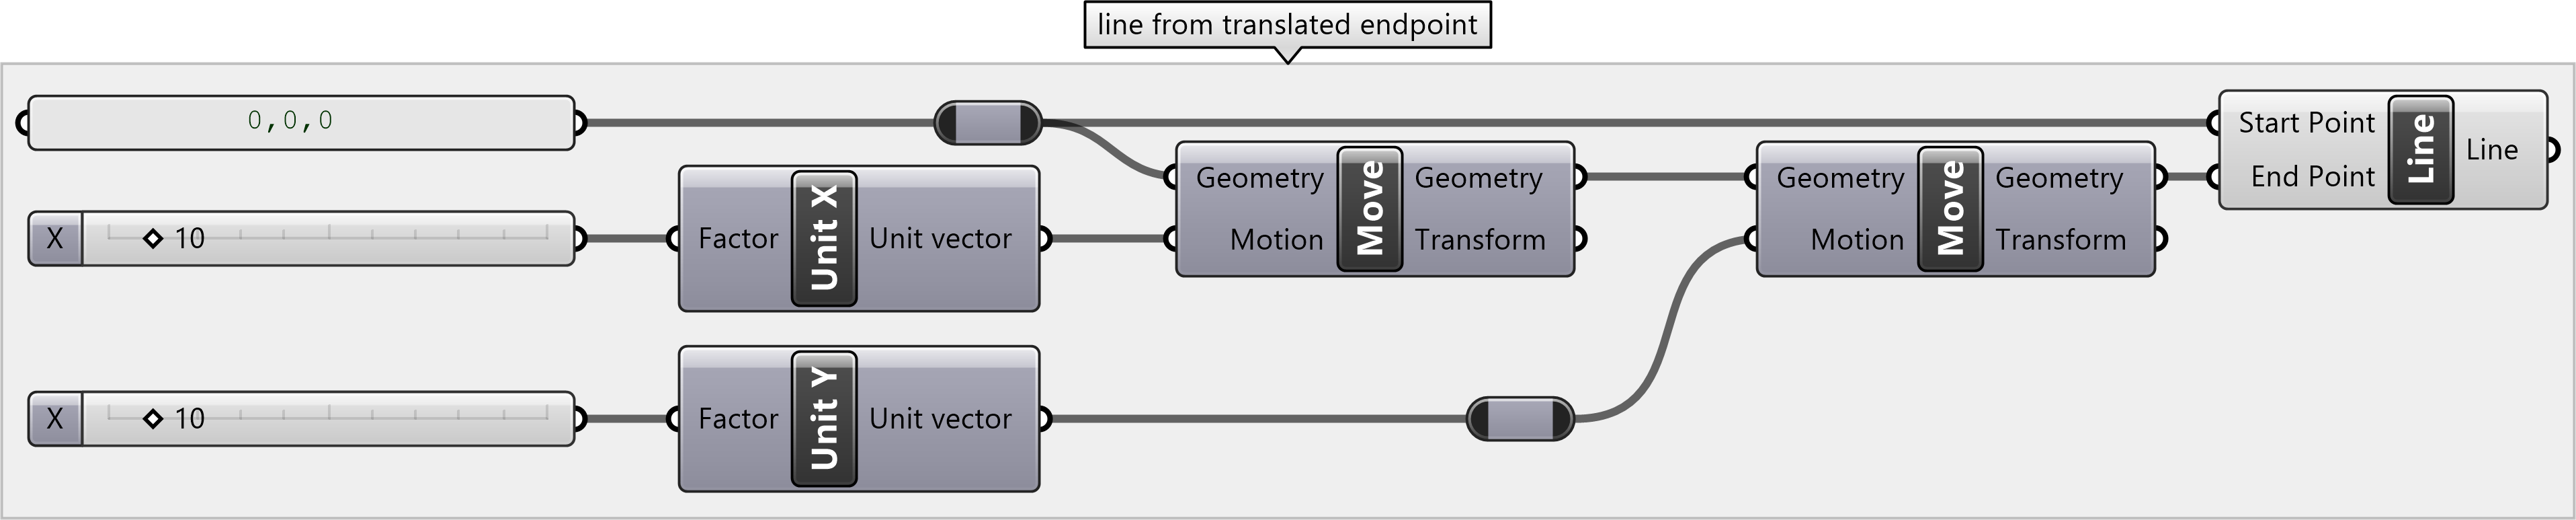
To construct a line whose end point is relative to its start point,
first define a starting point
and then move it along a vector to the end position.
Start by placing a
Line
component.
Define its start point using a Point parameter, Panel, or
Construct Point component.
Then add a
Move
component to translate the point to a new position.
Connect the start point to the input Geometry parameter
for the Move component
and connect the output Geometry component
to the end point parameter for the Line component.
Then connect a vector to the Motion input parameter for the Move component.
For example add and connect a
Unit X
vector to set the direction of movement along the x-axis.
Then connect a Number Slider parameter
to the input Factor for the
Unit X
vector to set the length of movement.
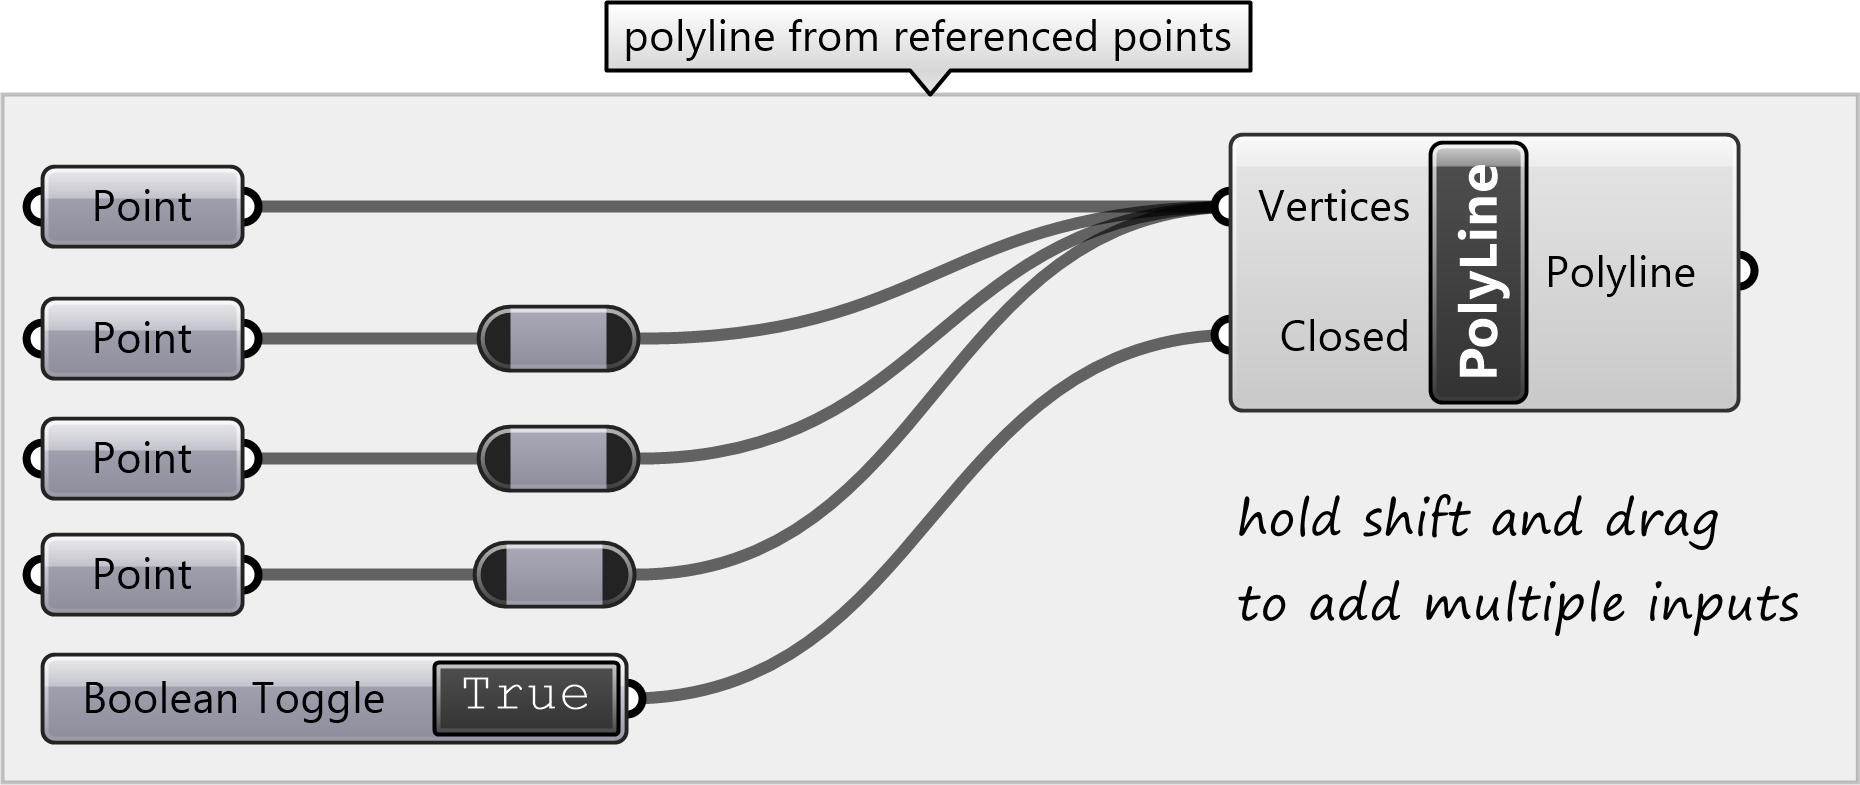
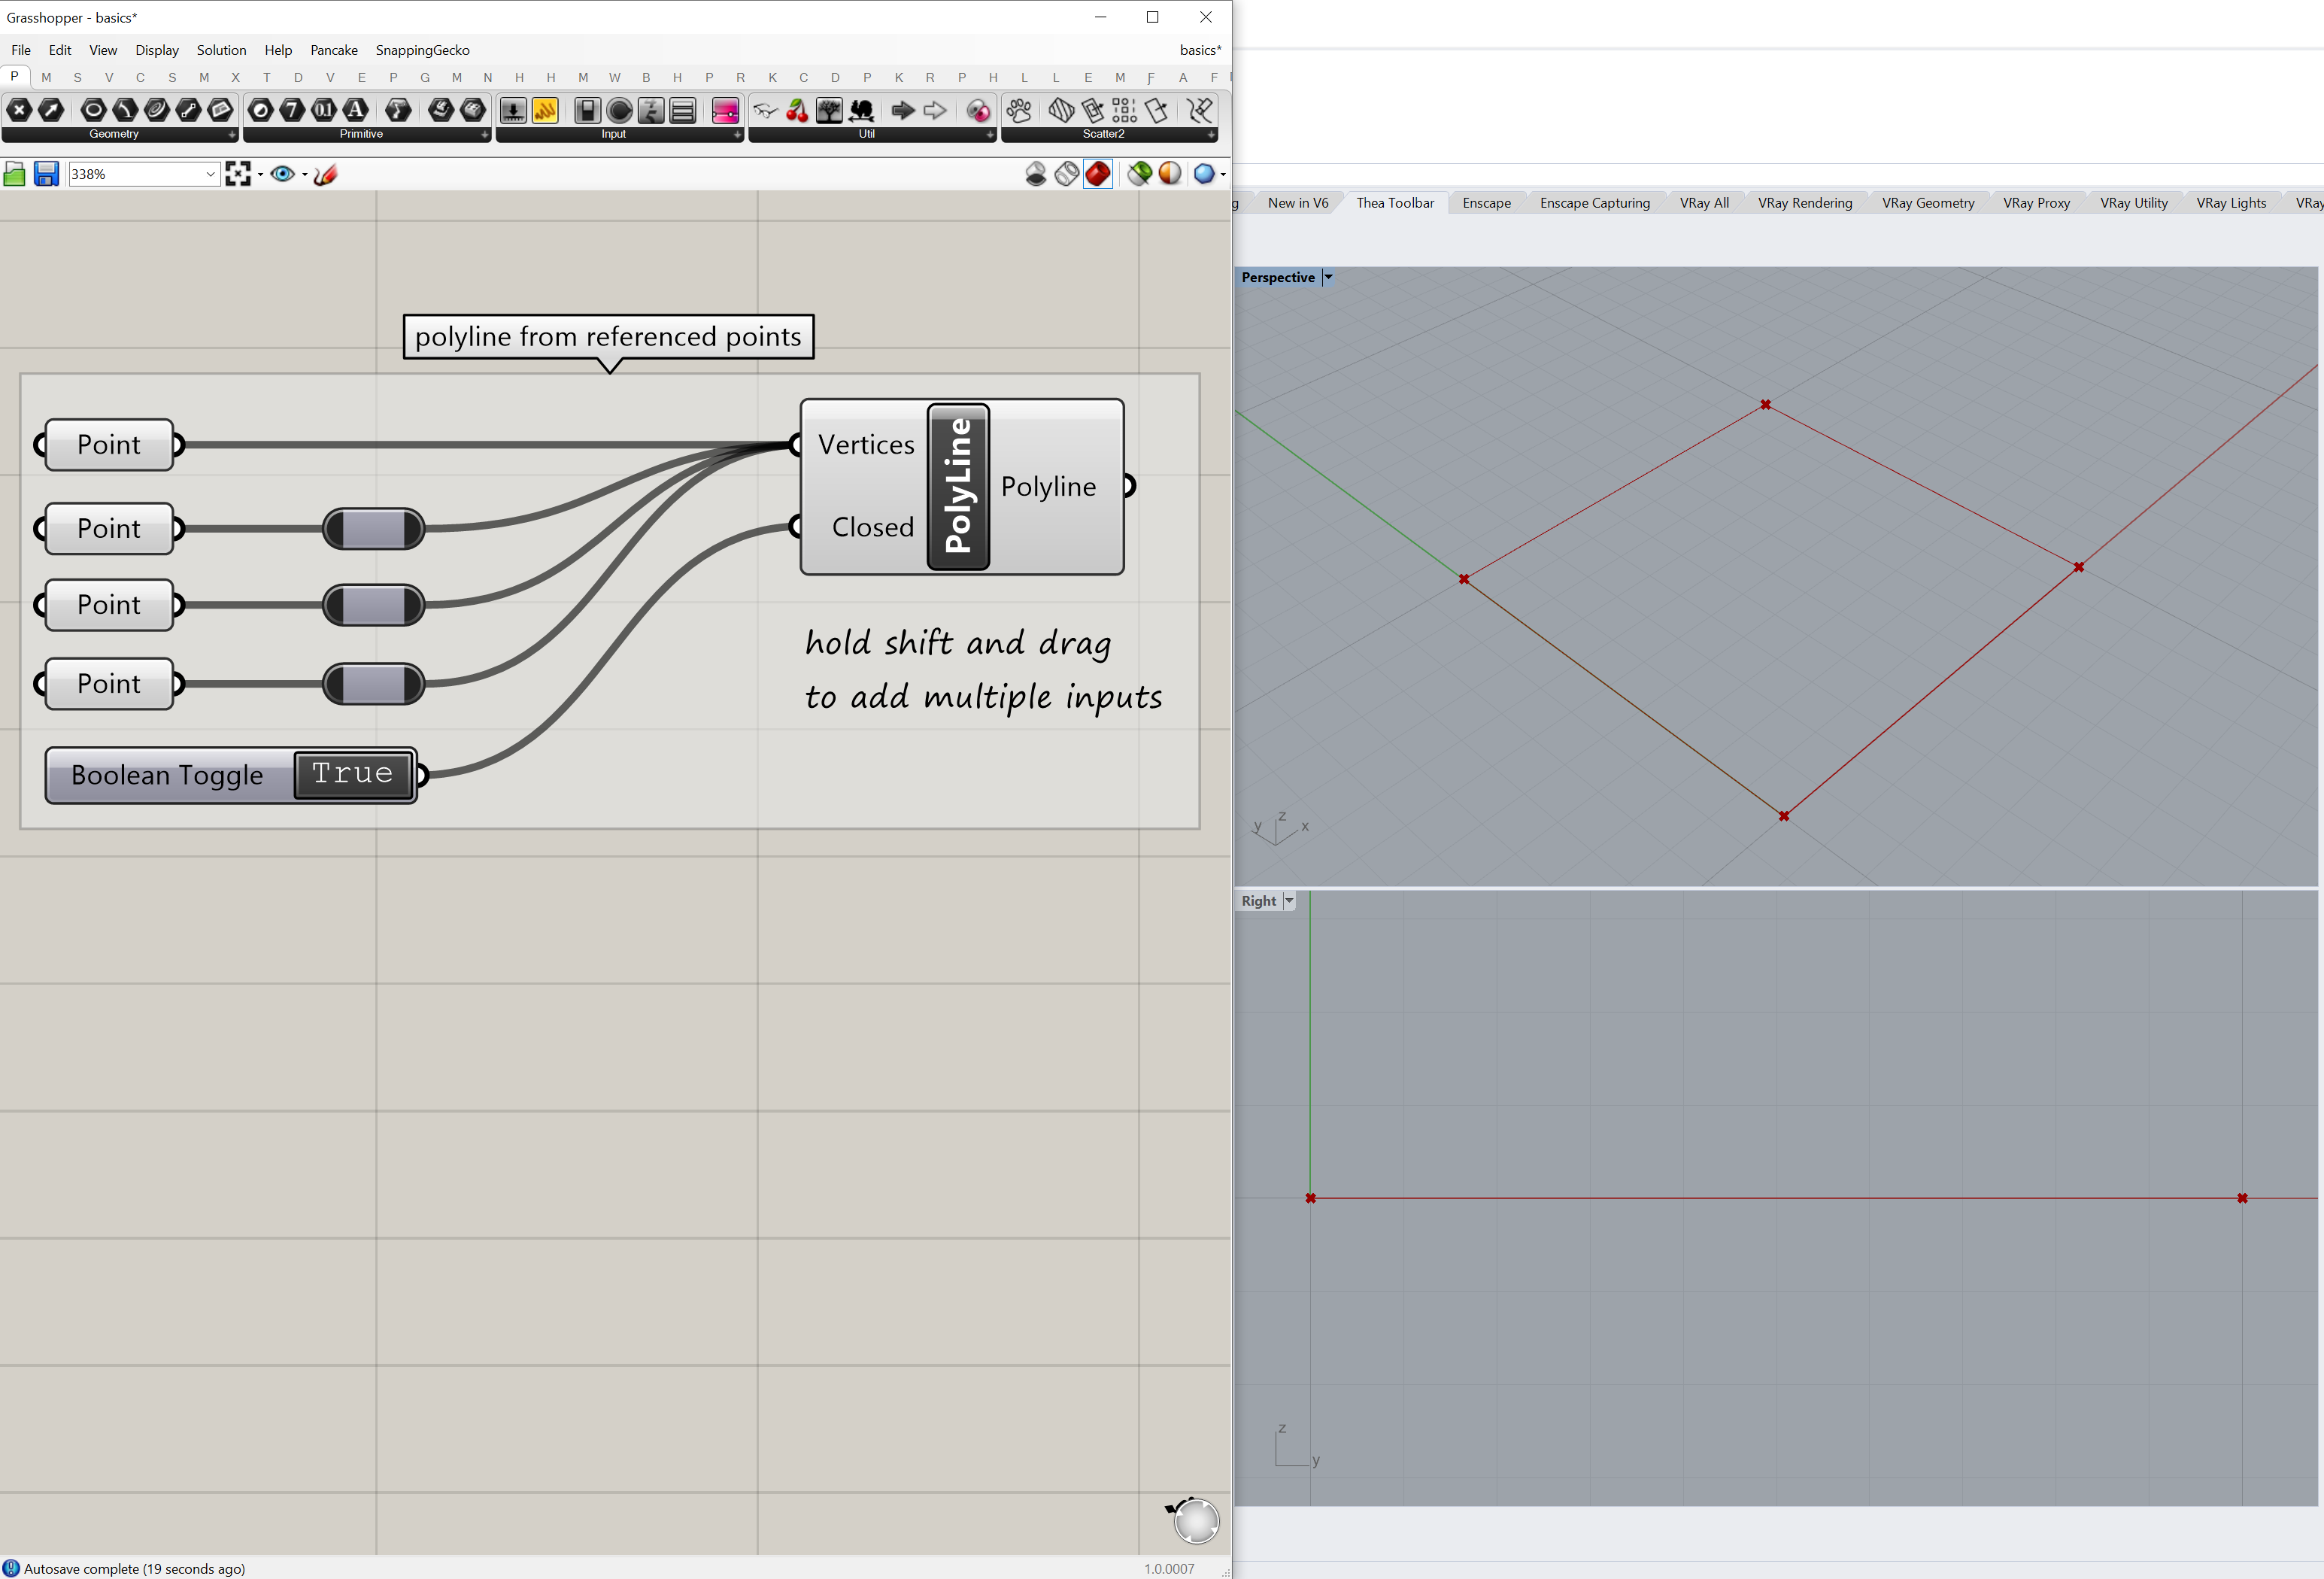
Polylines
Polylines are a sequence of lines connecting an ordered collection of points.
They can be closed to form polygons.
Place a
Polyline
component and then connect multiple points to the Vertices input parameter.
Hold shift while dragging wires to add multiple inputs.
To close the polyline and form a polygon, set the Closed input parameter
to True either by adding a Panel or a Boolean Toggle.
Double click on the Boolean Toggle to change its state from true to false.
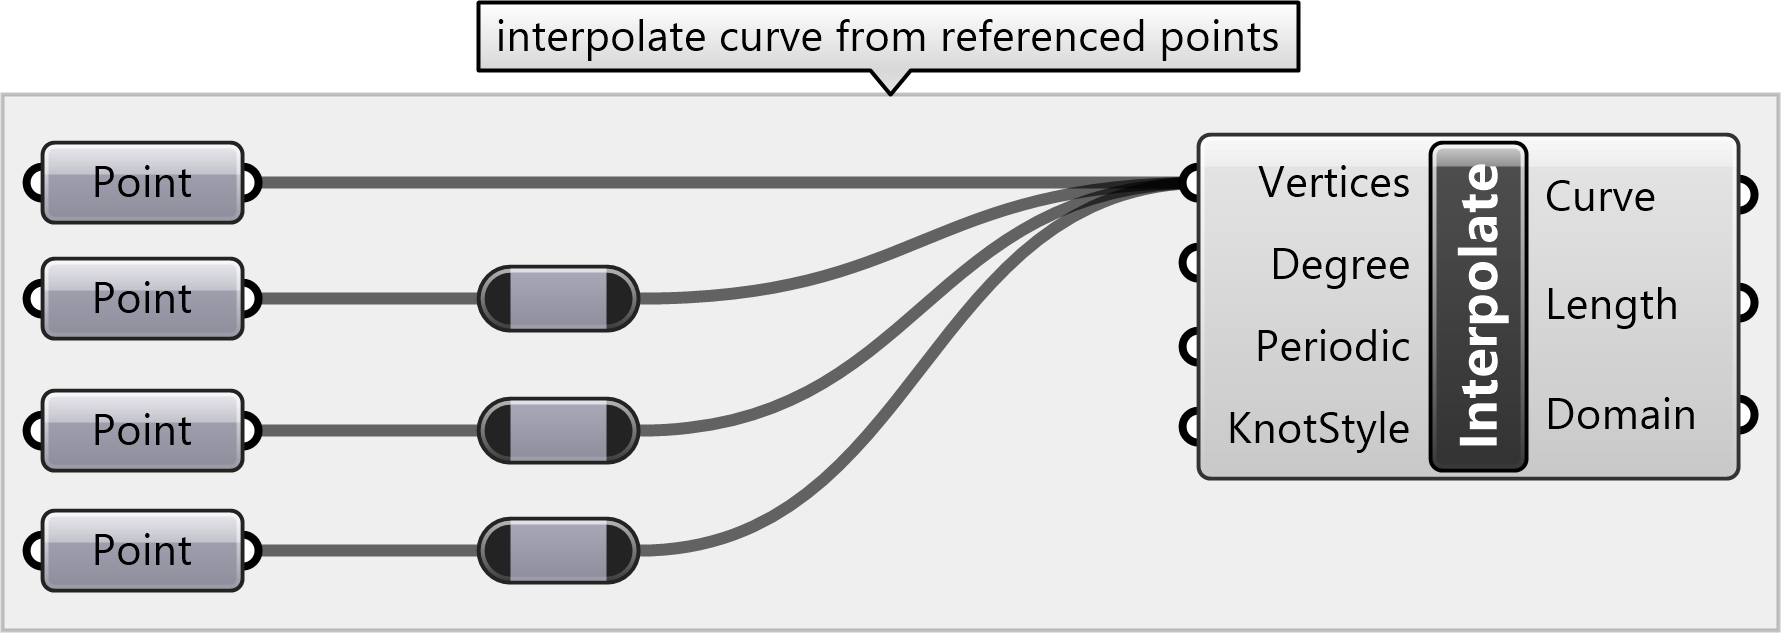
Curves
Non-uniform rational basis spline (NURBS)
curves are interpolated through a set of control points.
To draw a curve place an
Interpolate
component and connect its input vertices parameter to a set of points.
Points for a curve can be created from x, y, z coordinates with the
Construct Point
component or a Panel parameter,
drawn in Rhino and referenced with a Point parameter,
or generated from a trigonometric function such as a sine wave.
Point parameters can easily to be edited using the gumball
to change the shape of the curve.
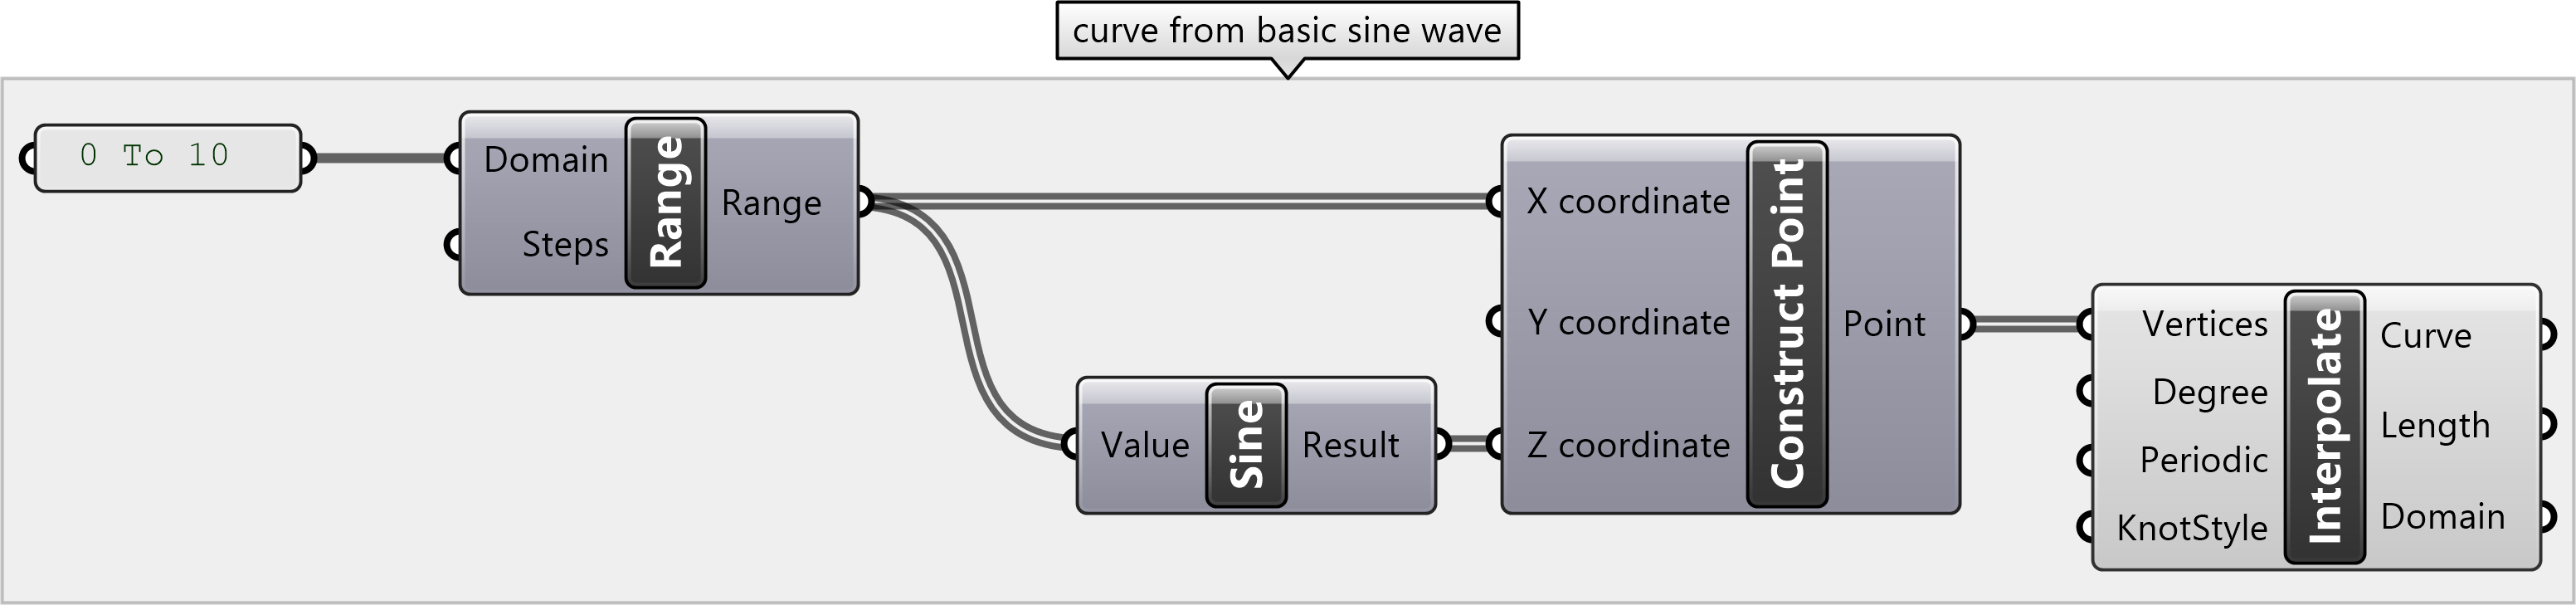
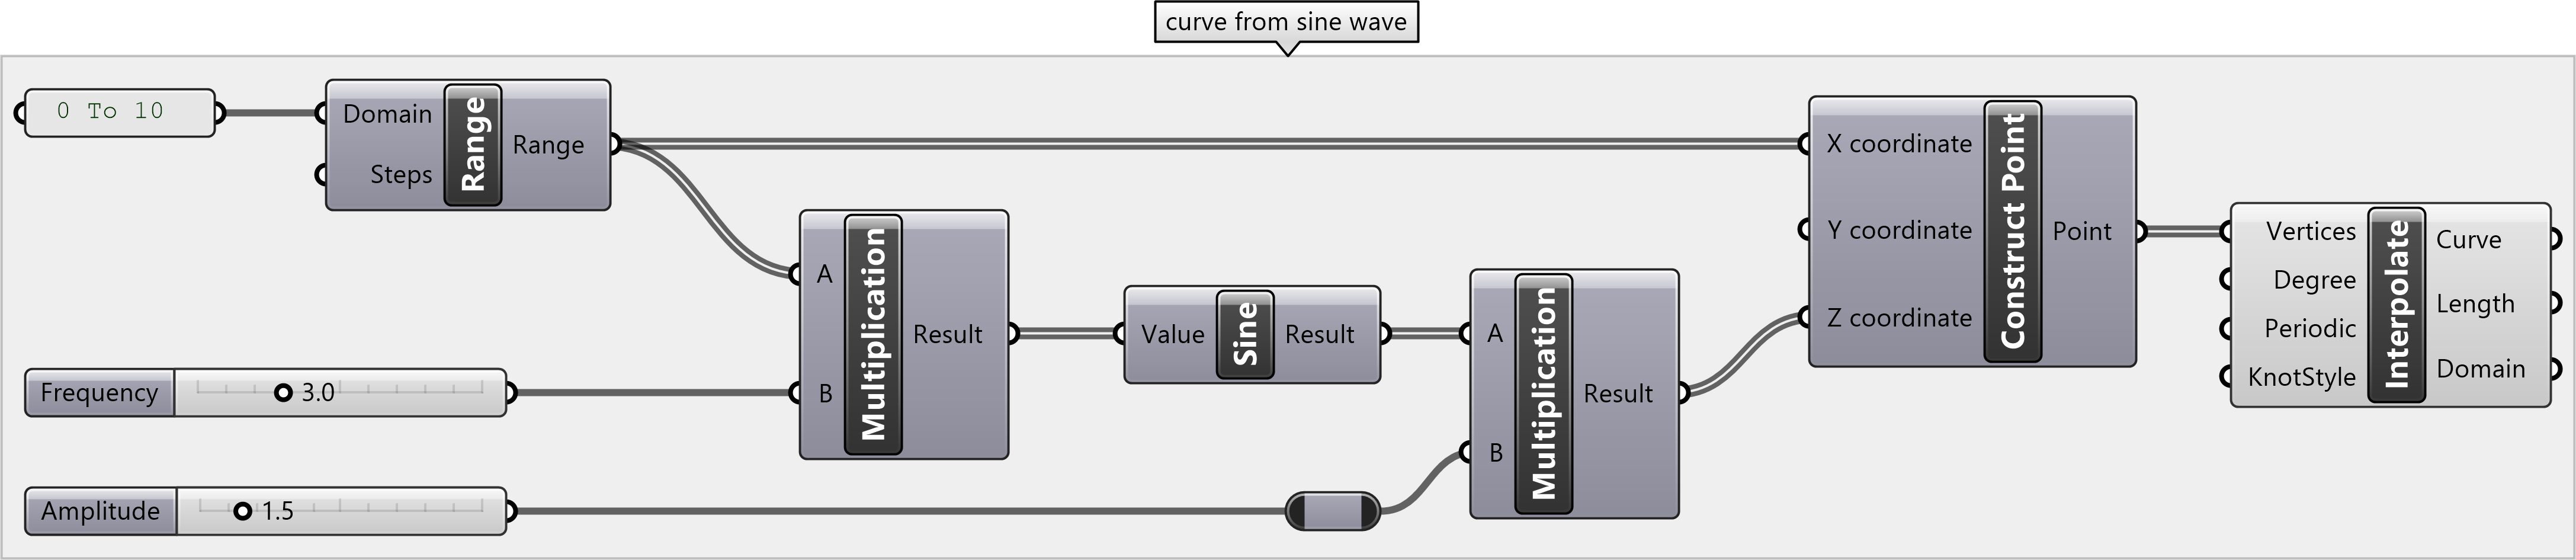
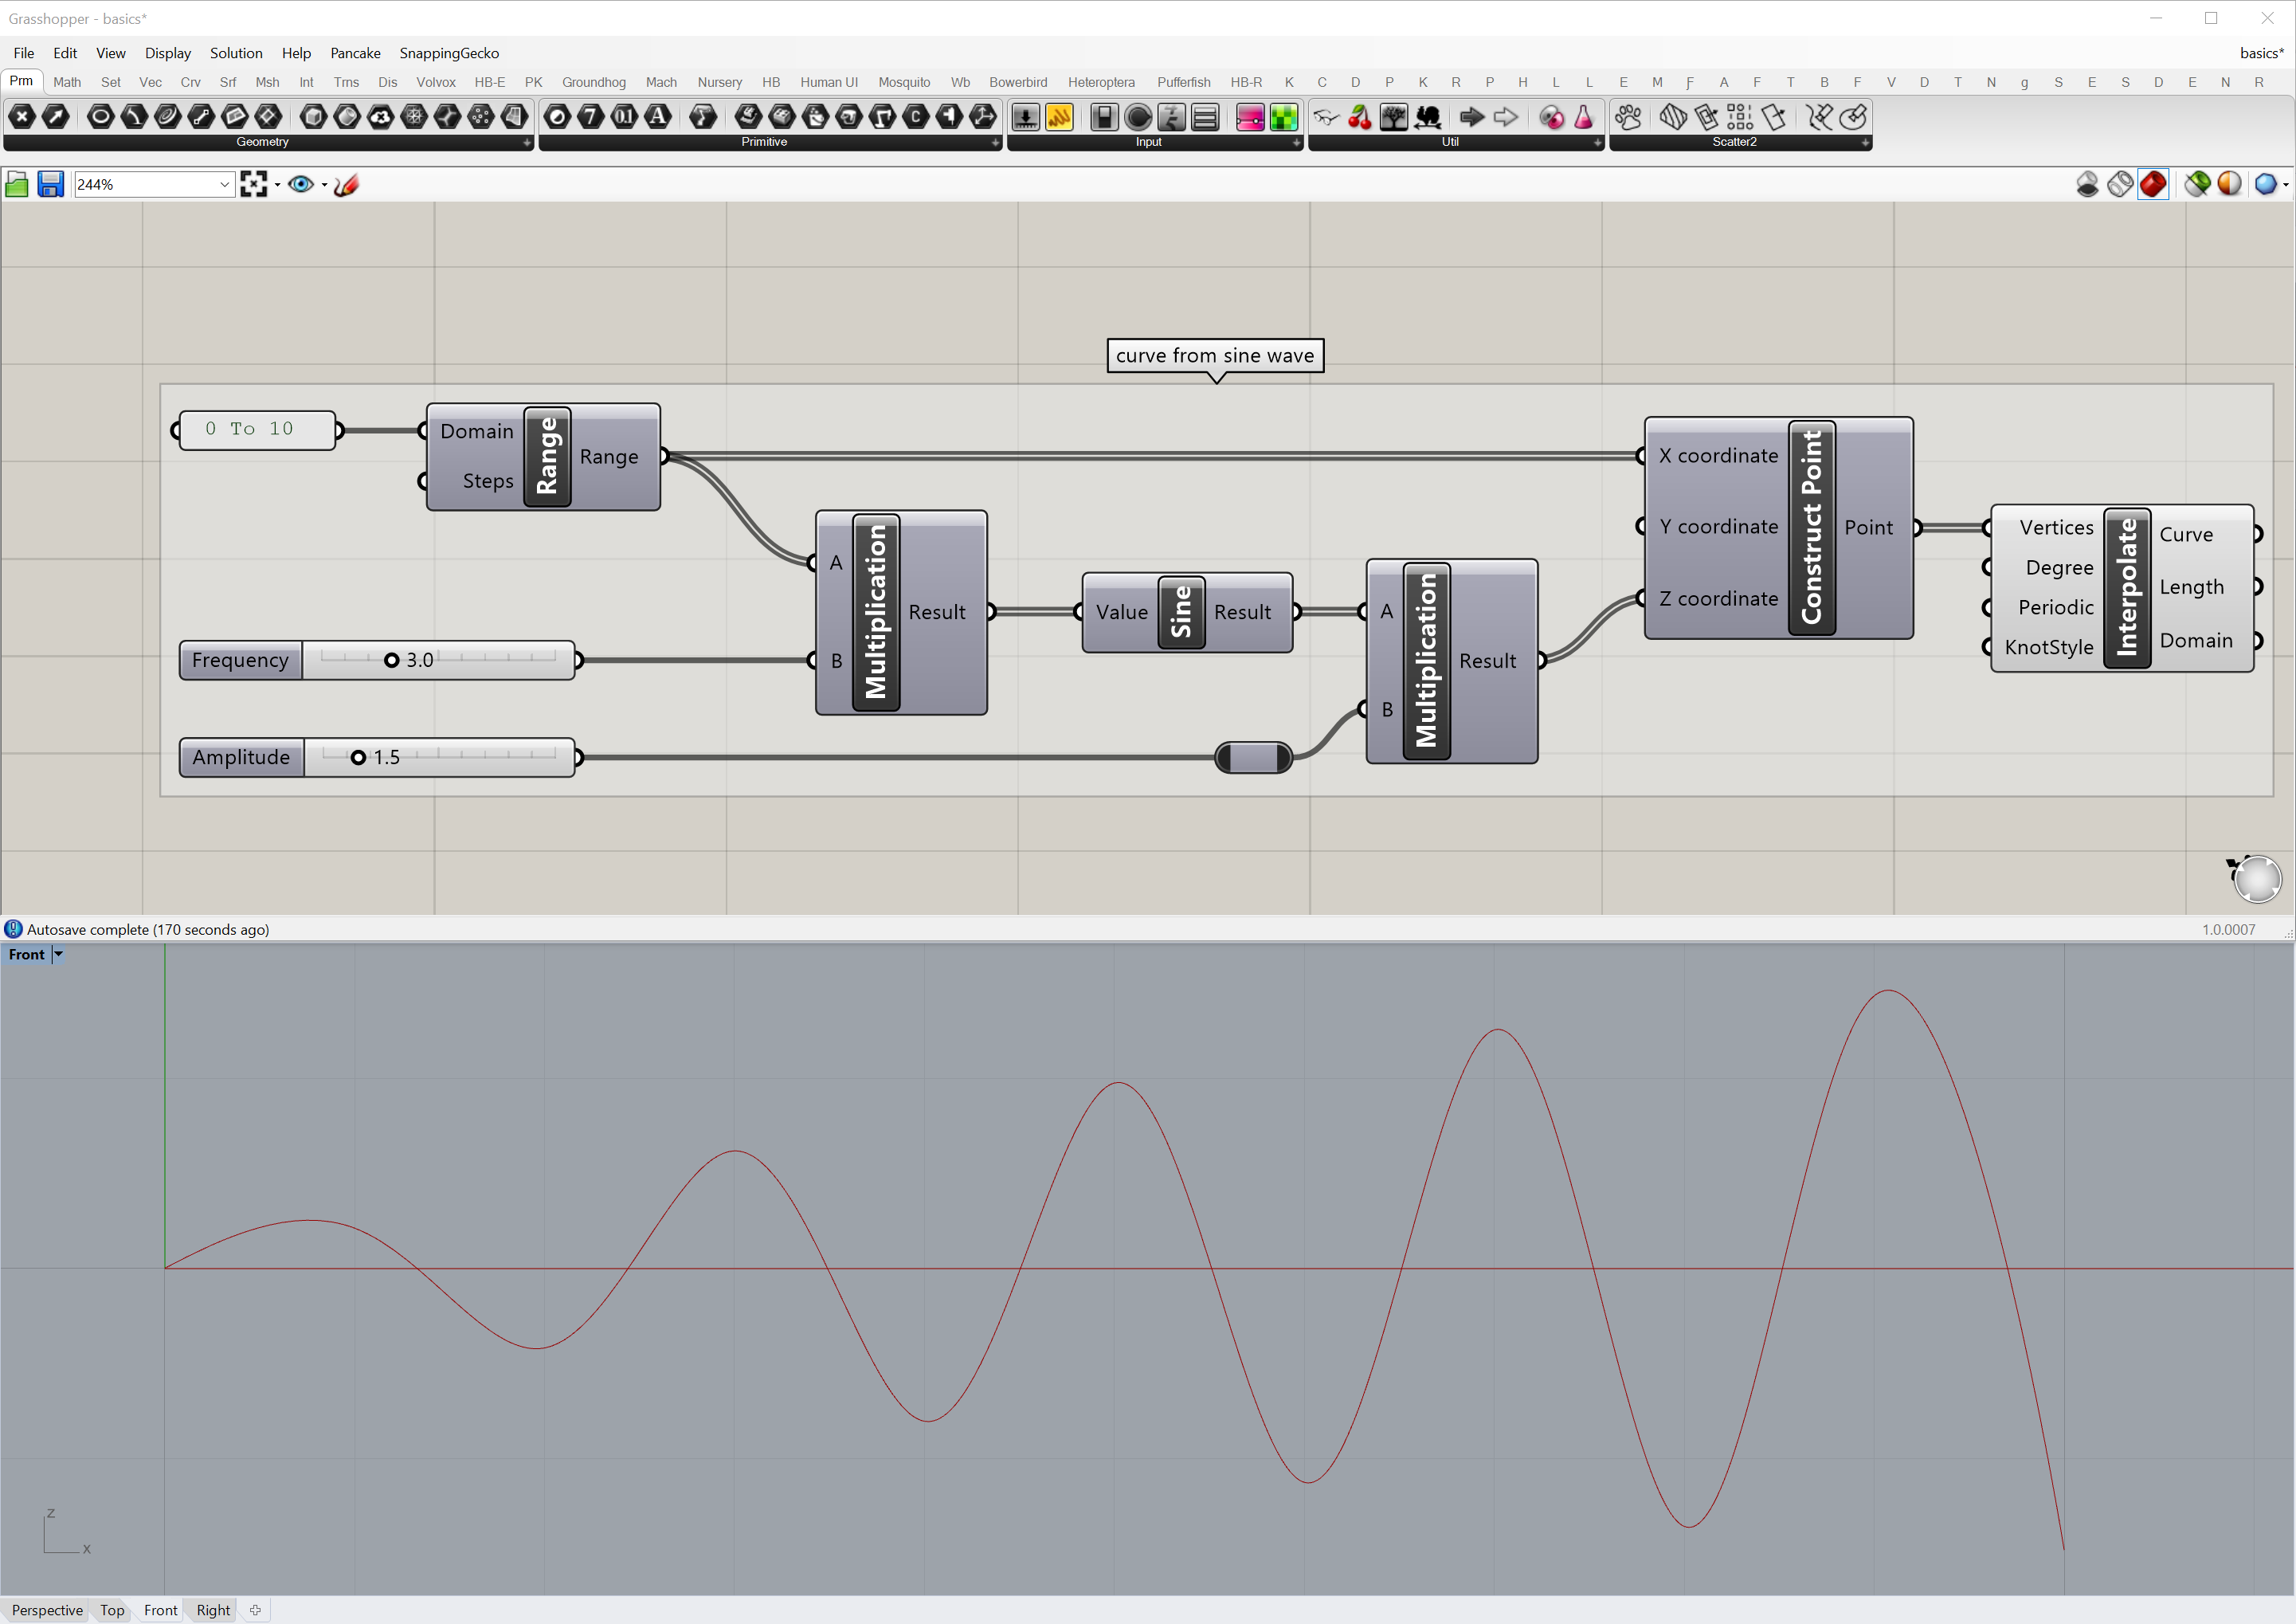
To create a curve from a sine wave
first generate a range of values from for example 0 to 10 using the
Range
component.
Connect the range to the x coordinate of a
Construct Point
component.
Also connect the range to a
Sine
component and then connect the output of the sine function
to the z coordinate of the Construct Point component.
Connect the point to the Vertices input parameter of an
Interpolate
component.
Try changing the domain, frequency, and amplitude of the sine wave.
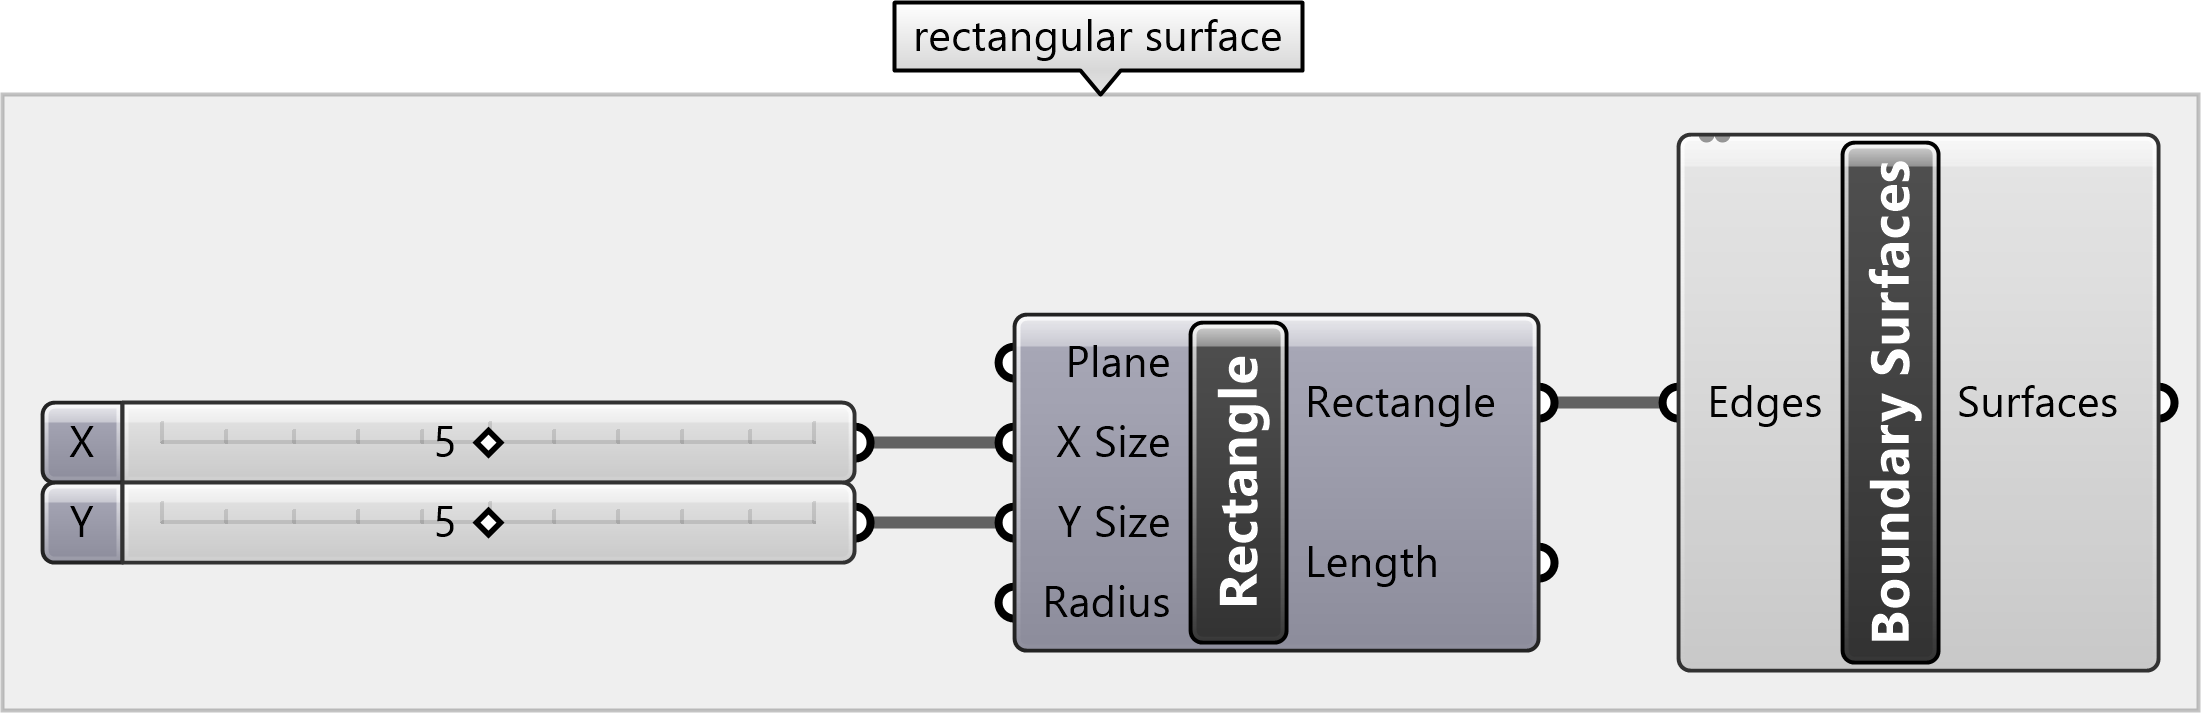
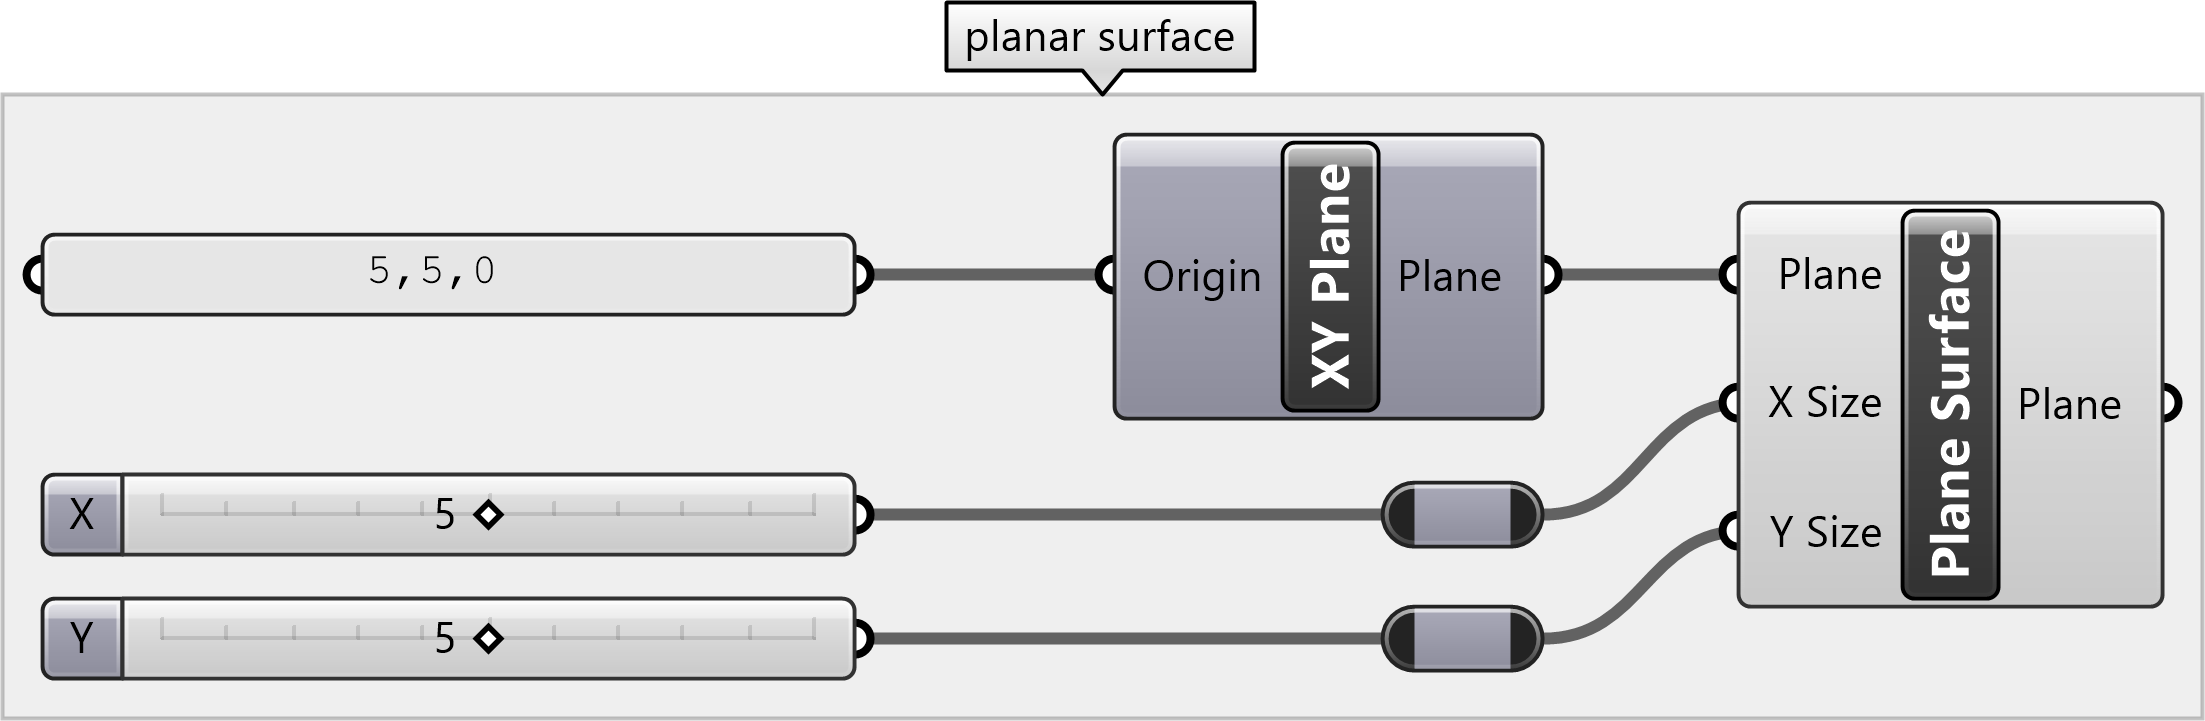
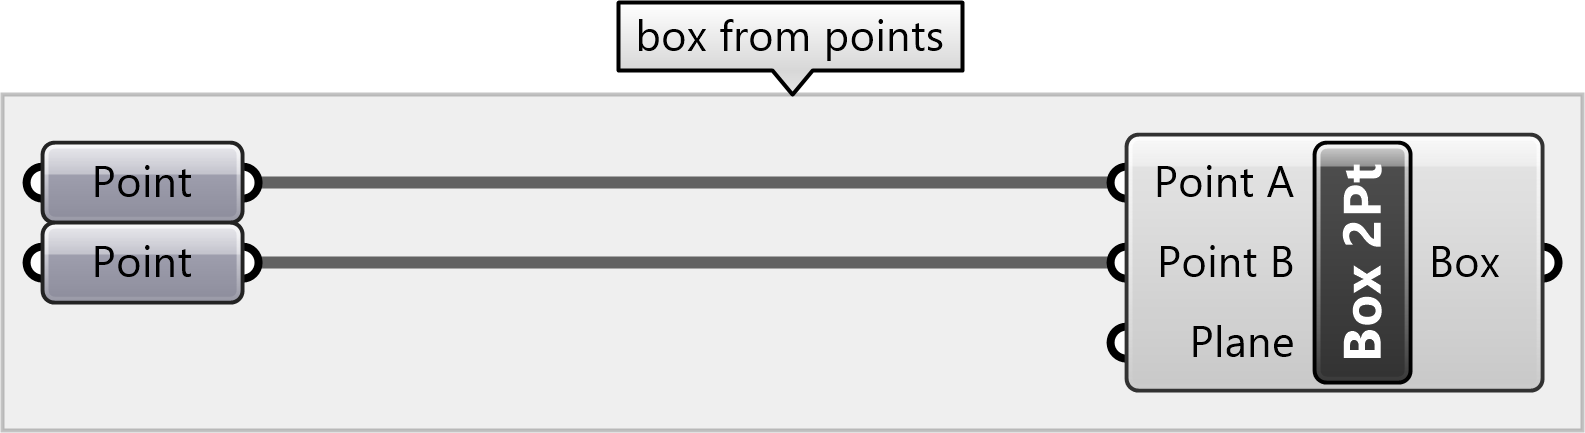
Surfaces
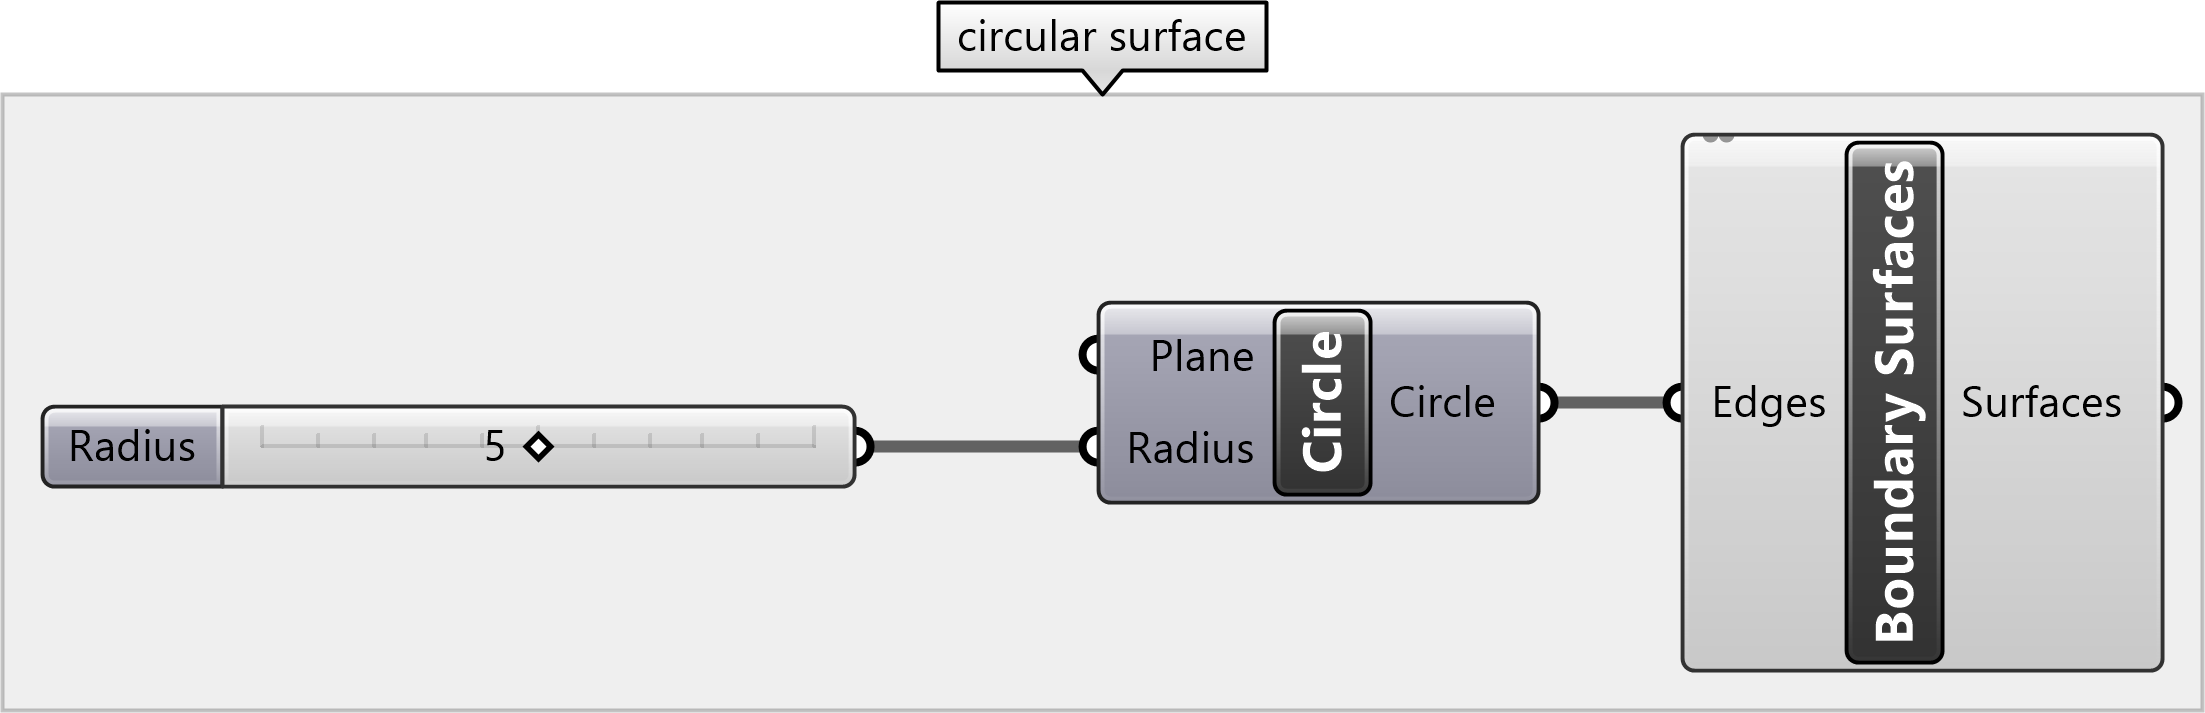
NURBS surfaces are interpolated through a 2-dimensional grid of control points. Primitive surfaces can be generated with components such as Plane Surface, Box 2Pt, and Center Box. Freeform surfaces can be generated with components such as Boundary Surfaces, Ruled Surface, and Loft.
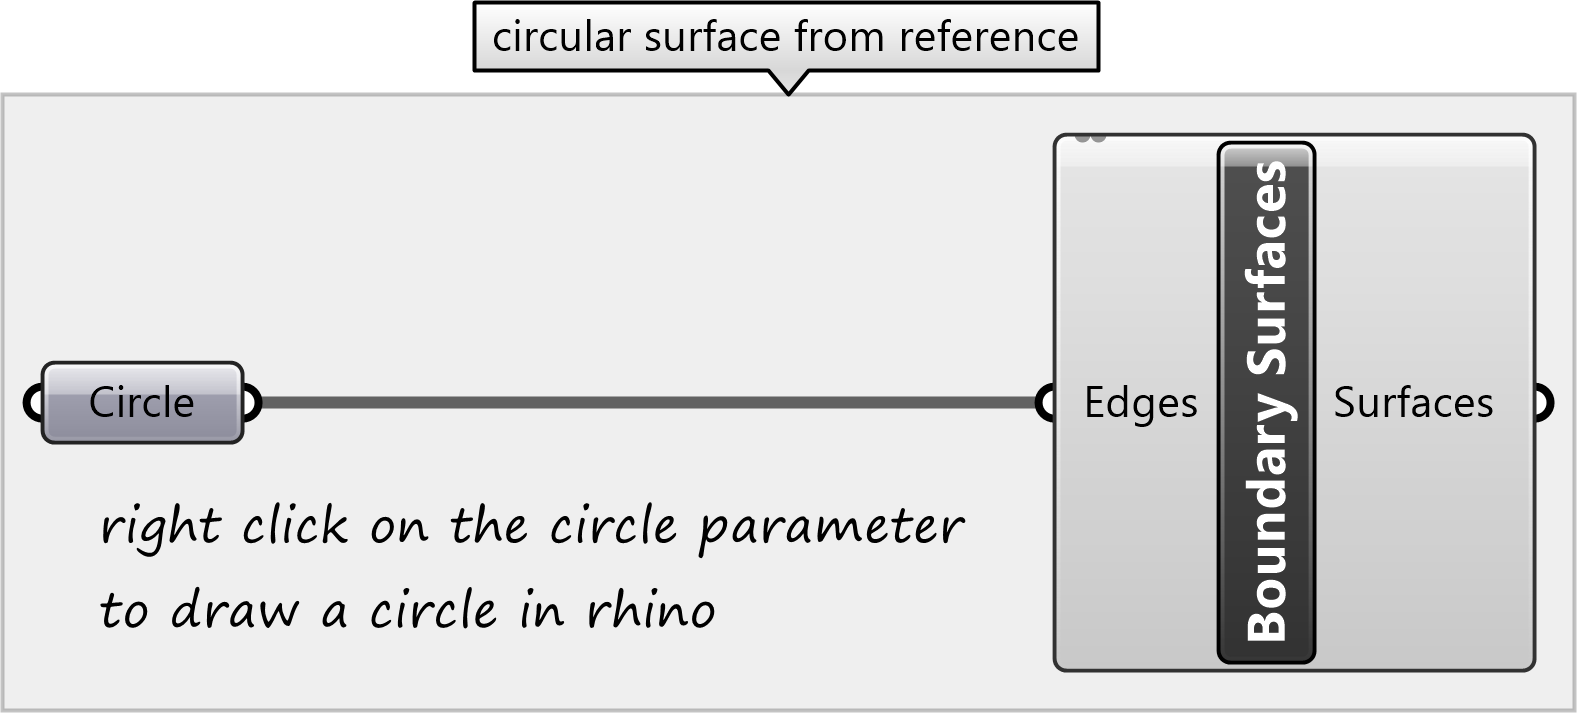
Create planar surfaces from planar curves with Boundary Surfaces or as primitives with components like Plane Surface.
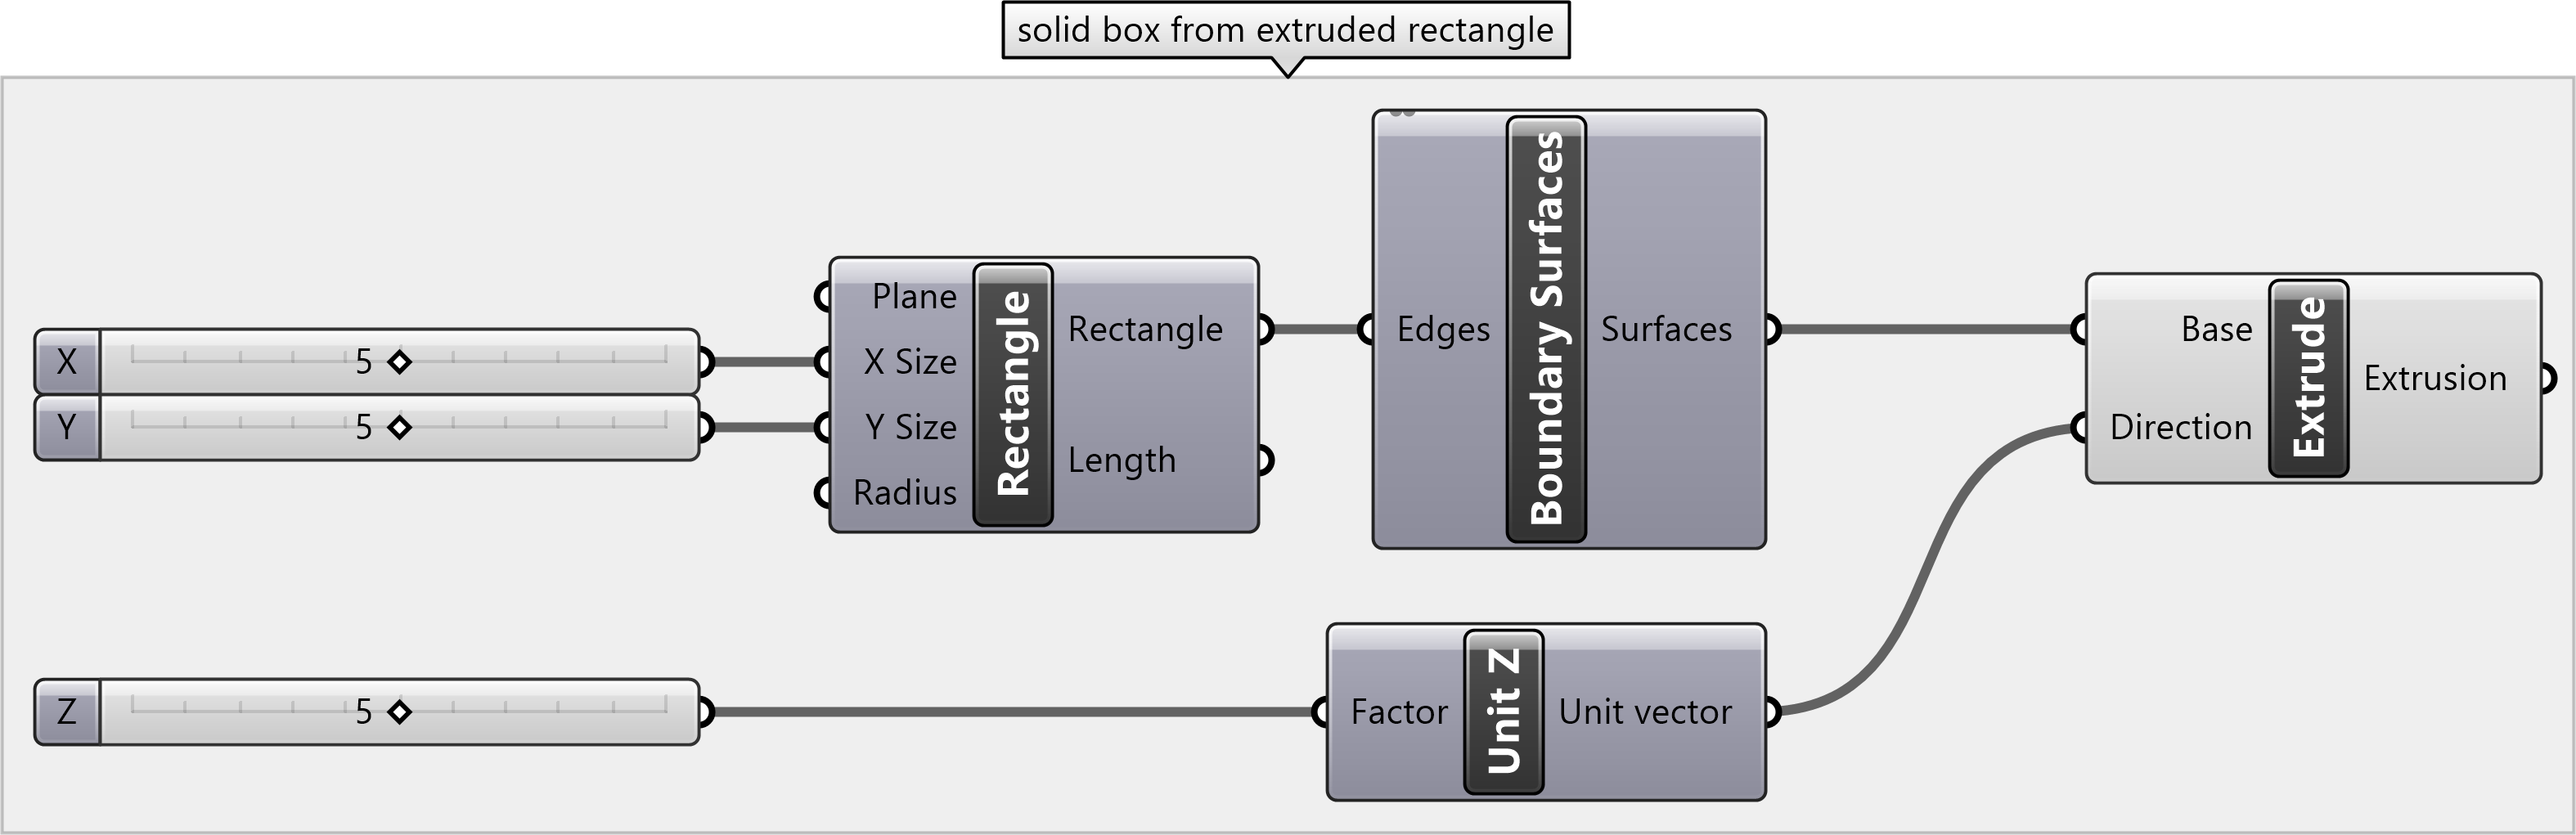
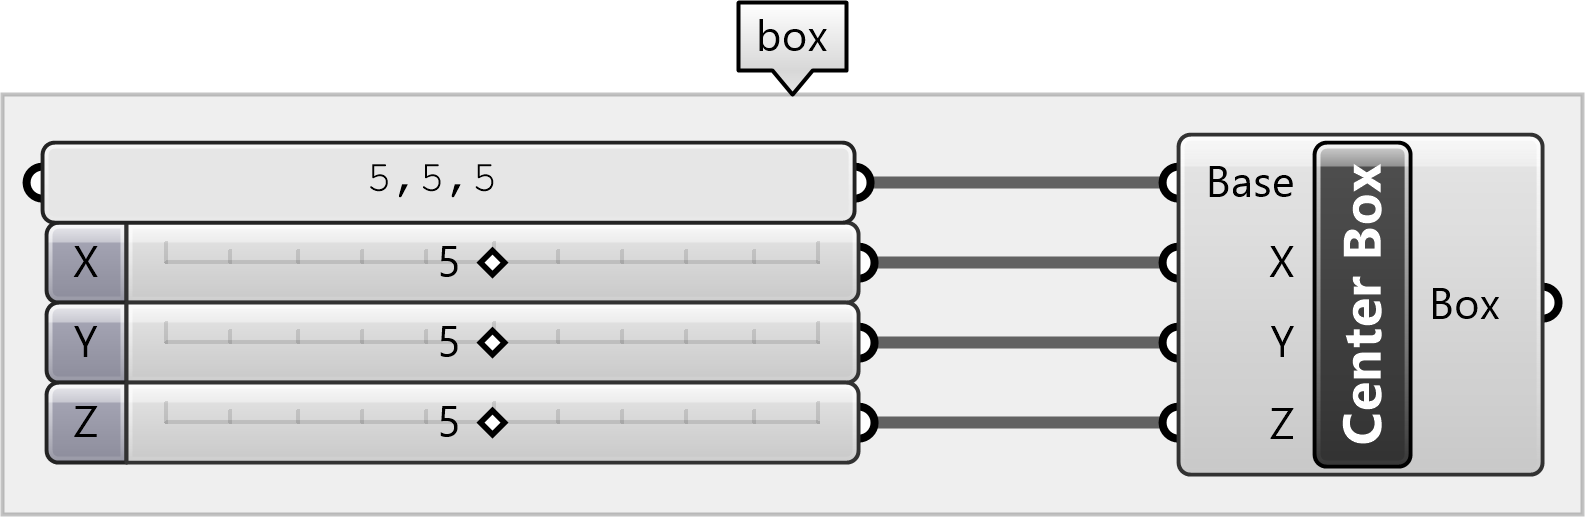
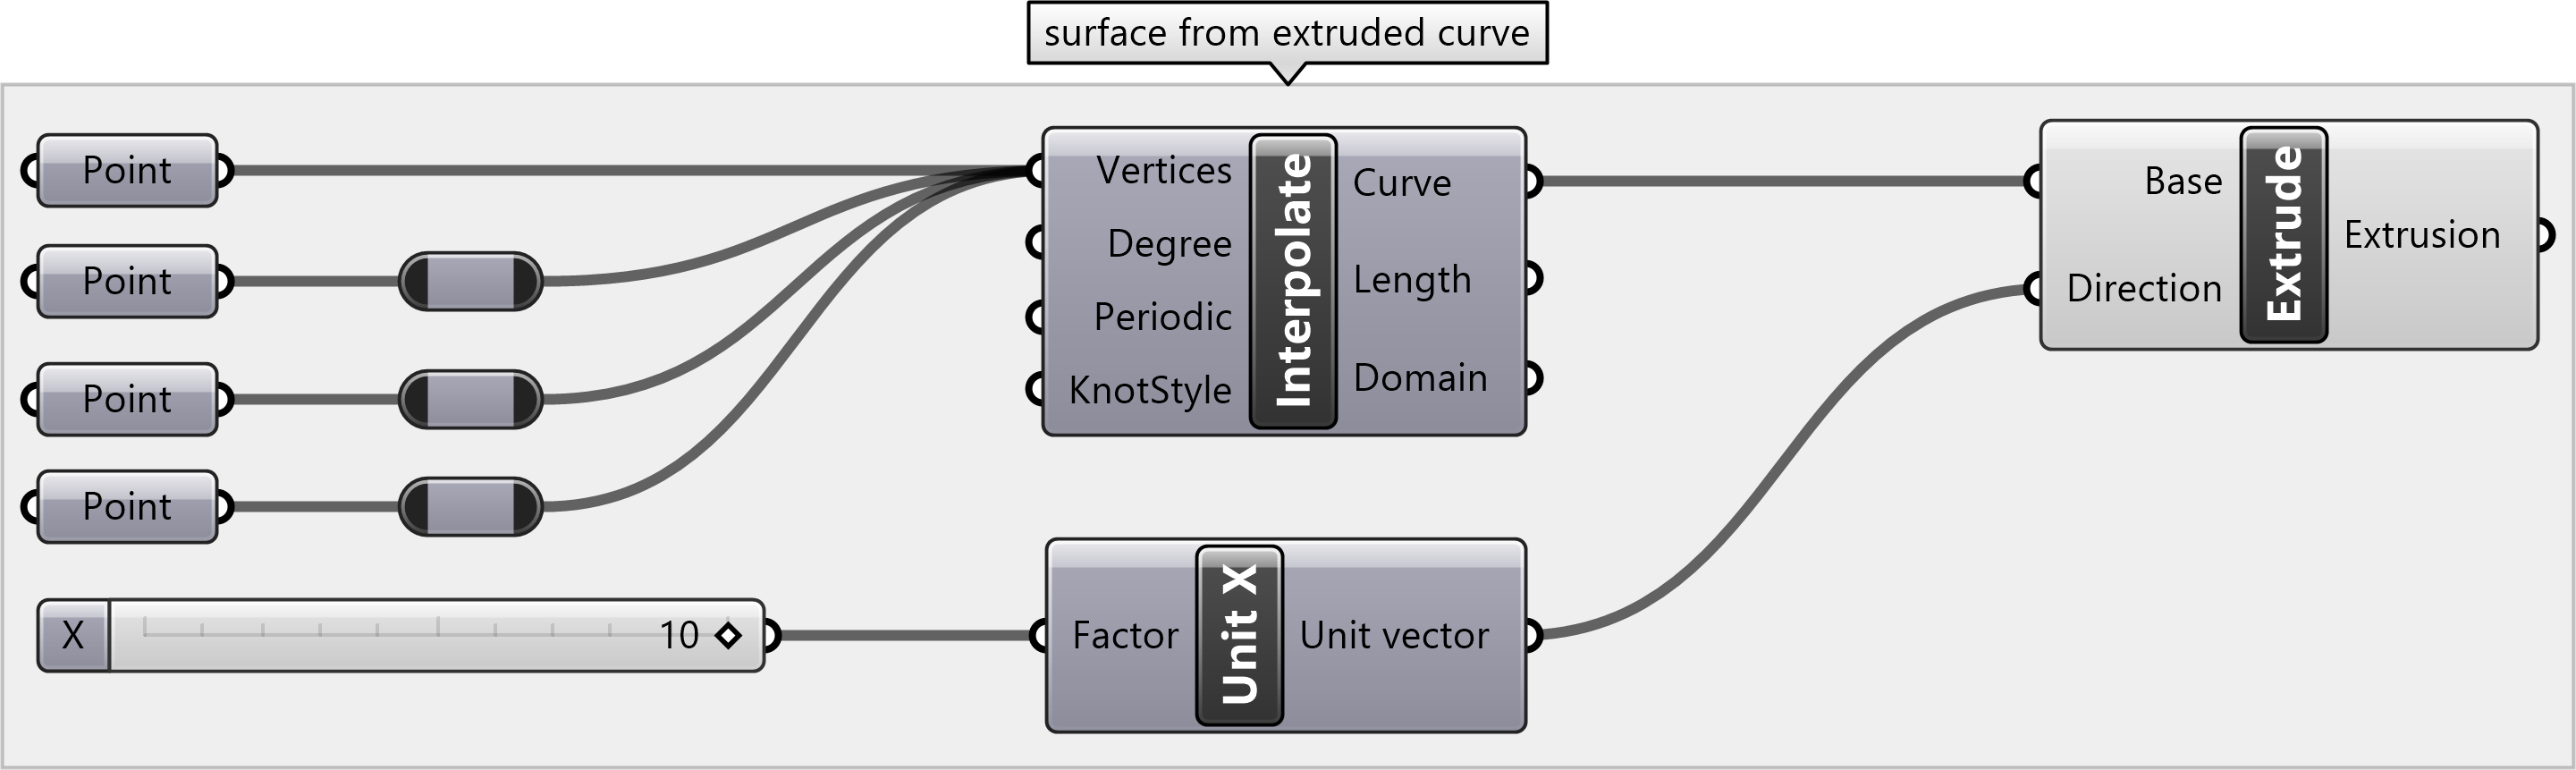
Create solids either by extruding surfaces with Extrude or as primitives such boxes or spheres.
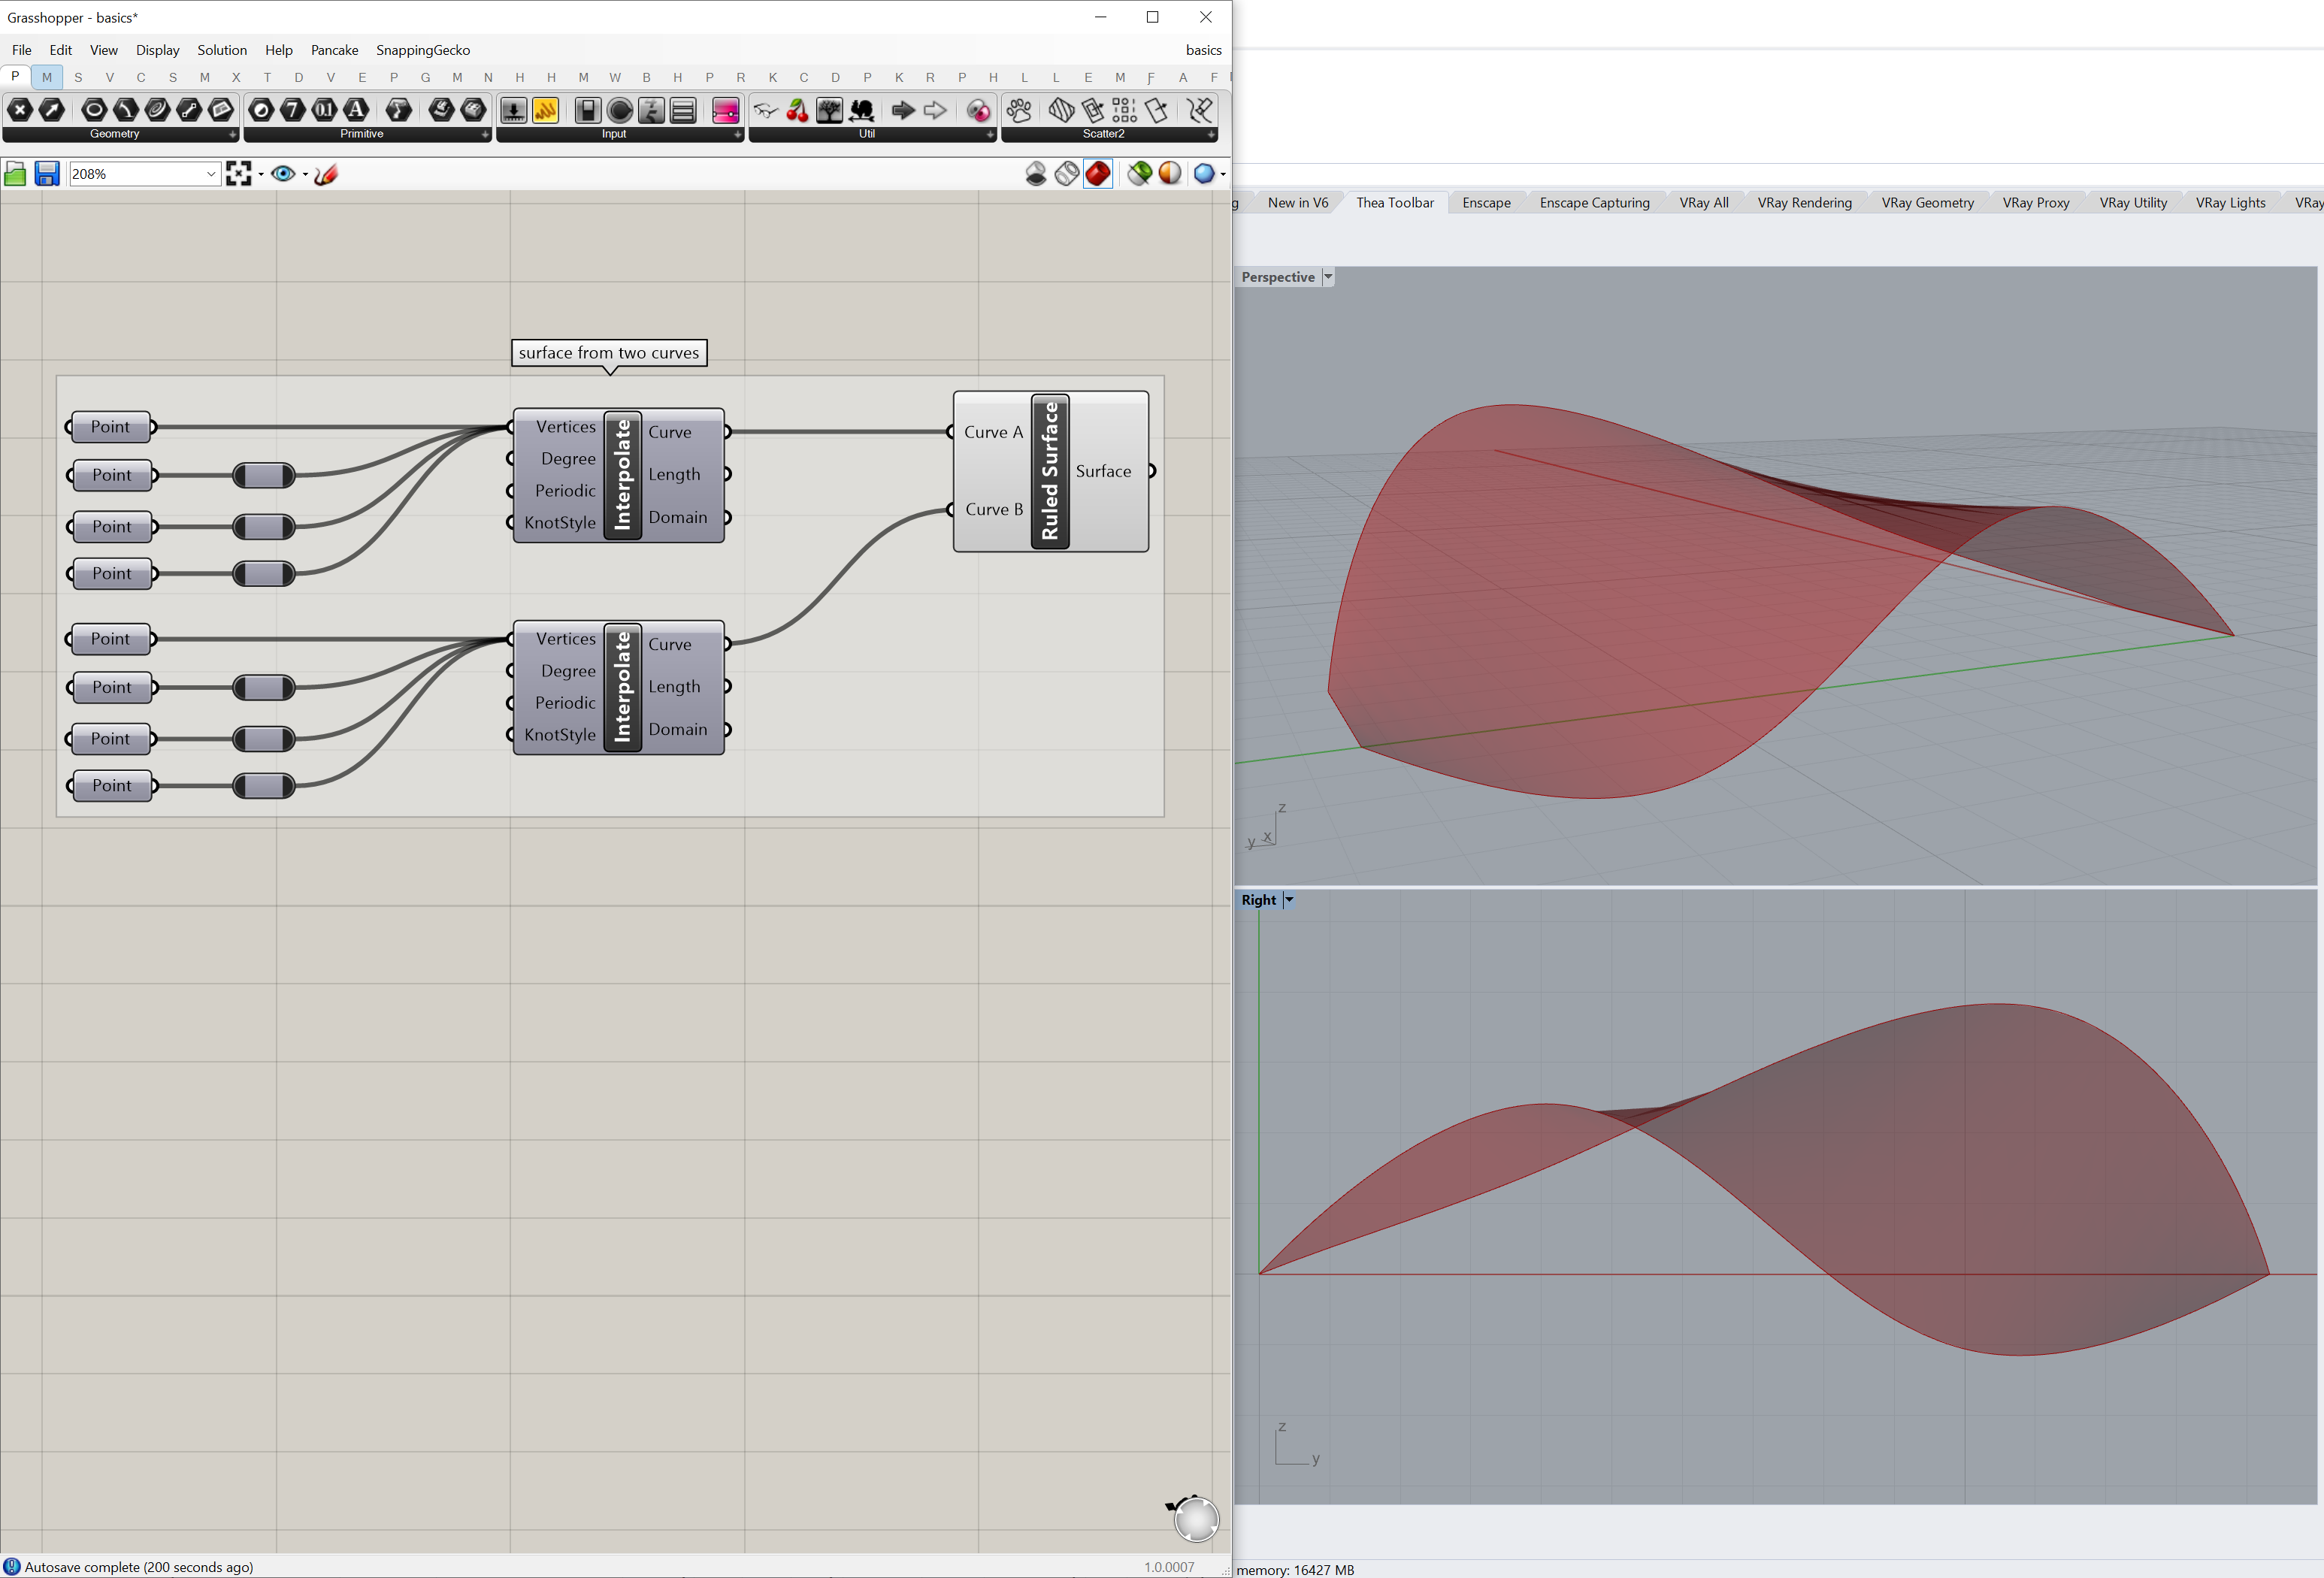
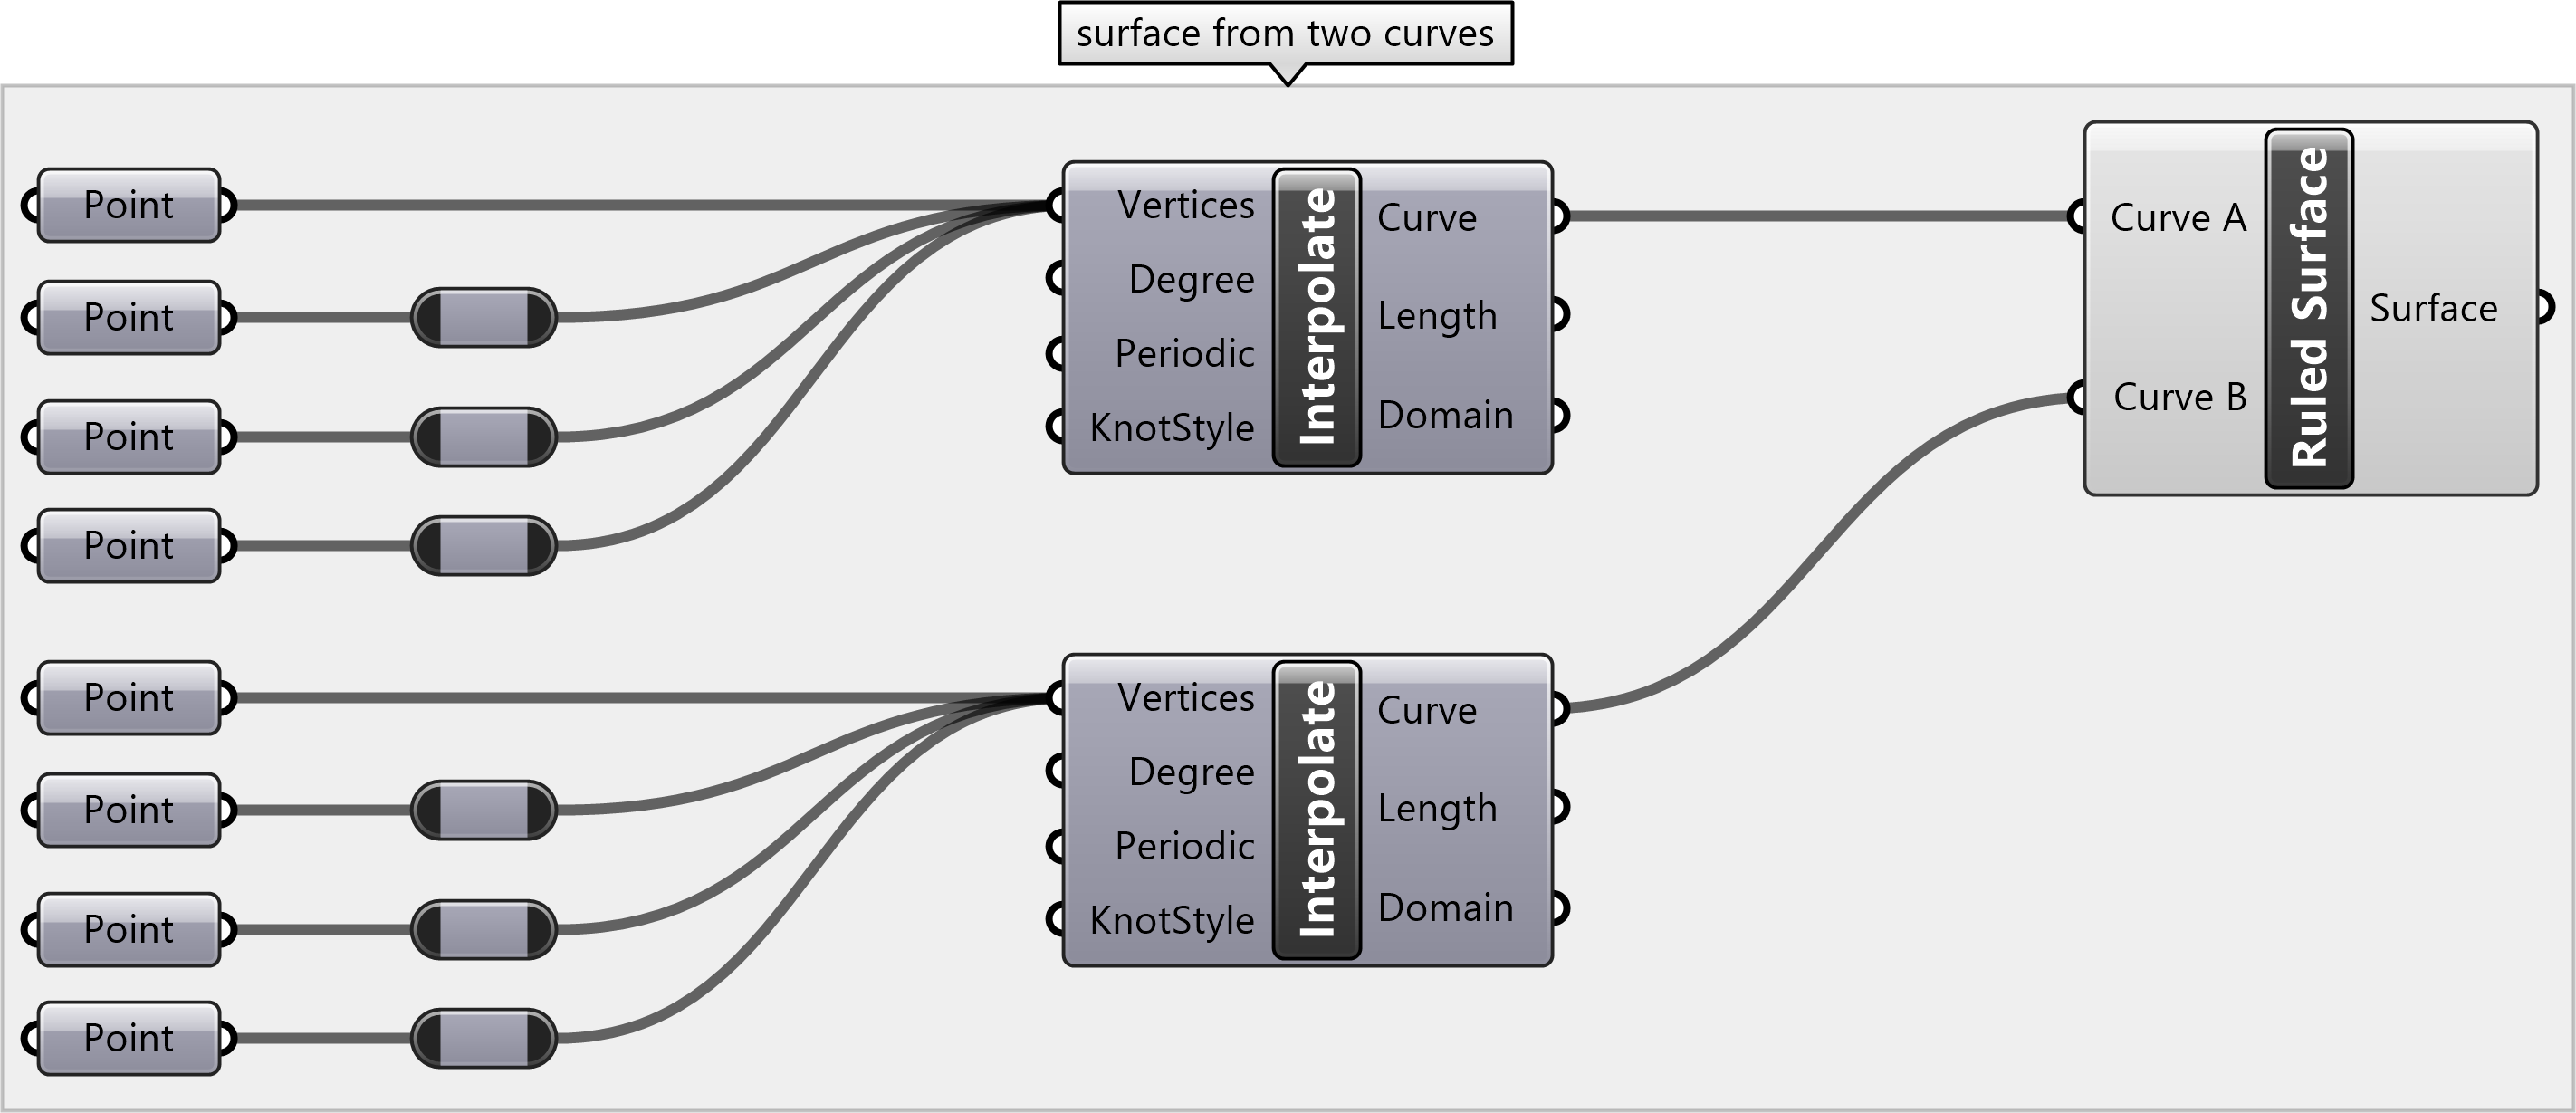
Freeform surfaces can be constructed from multiple curves with components like Ruled Surface, and Loft.
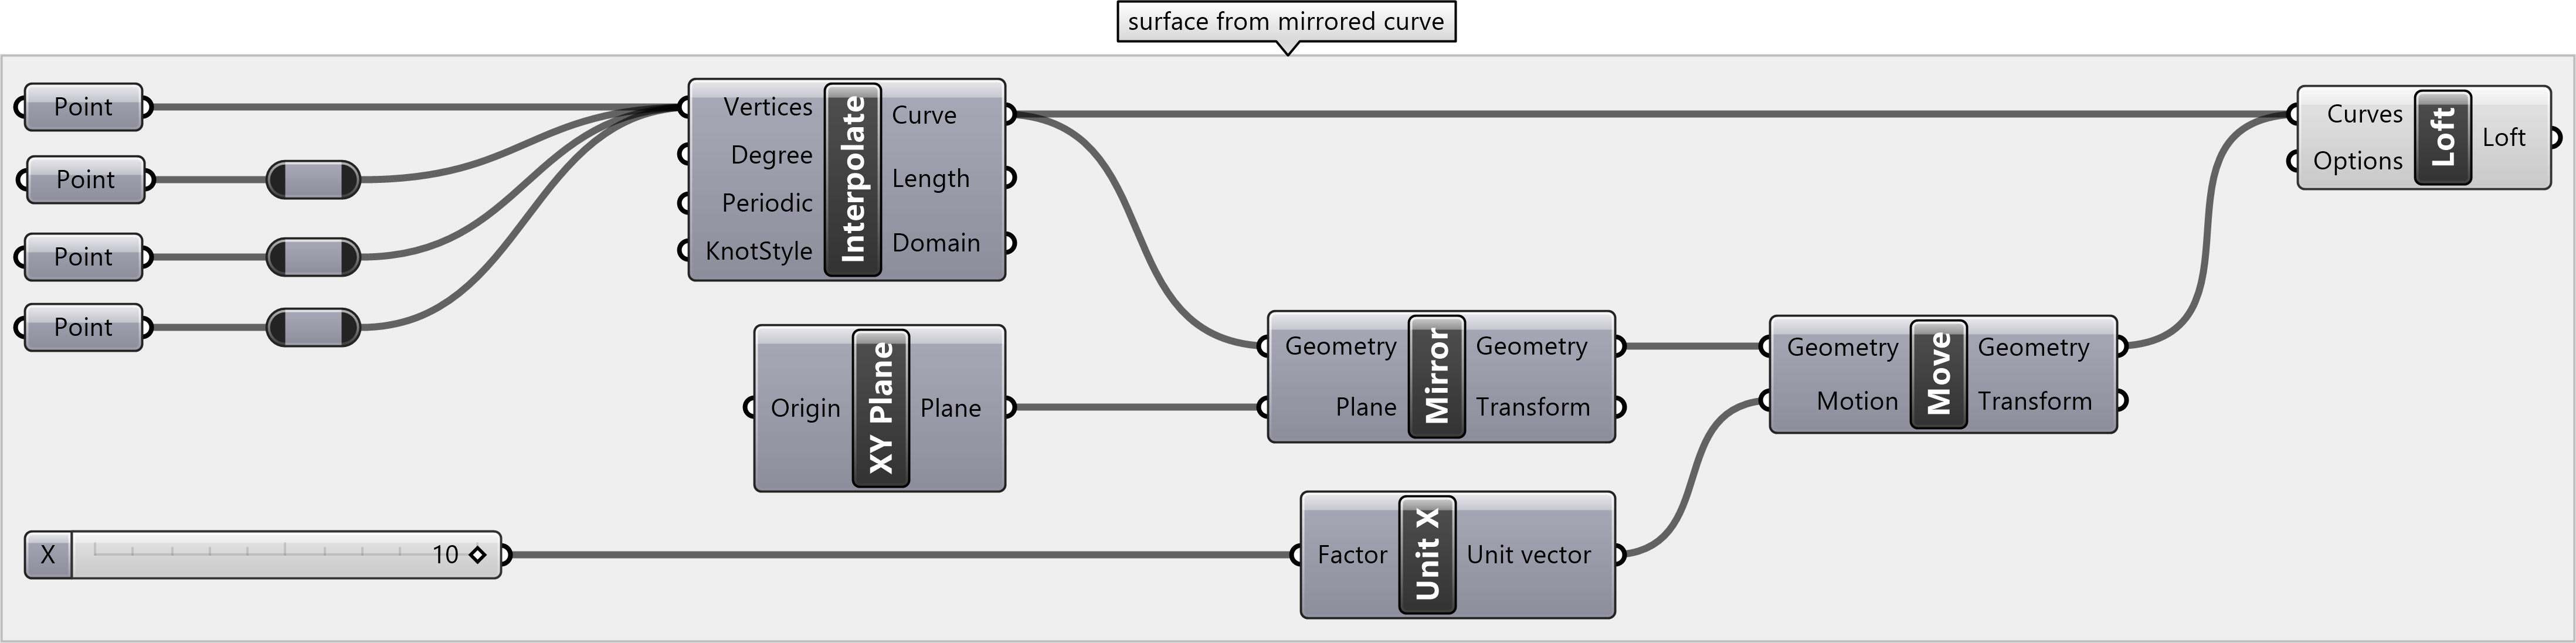
Learn how to transform this surface into furniture in the next tutorial: Modeling a Parametric Bench in Grasshopper.