Watersheds in GRASS GIS
A tutorial on watershed analysis in GRASS GIS.
Contents
Terrain Acquisition
This tutorial will use the terrain data from the National Elevation Dataset (NED). Either create a new location in GRASS using EPSG code 26915 or download and extract the Louisiana Dataset for GRASS GIS. Start GRASS GIS, set the GRASS GIS database directory, and create or select your location and mapset. Then use the addon module r.in.usgs to automatically import terrain data from the National Elevation Dataset. Alternatively you can download tiles of National Elevation Dataset from the National Map and then import, reproject, and patch them with r.import and r.patch.
To automatically import data from the National Elevation Dataset,
first install the addon module with
g.extension,
then set the region with
g.region,
and run
r.in.usgs.
With g.region
set the extent of the computational region
to north, south, east, and west boundaries
for Tunica Hills, Louisiana, USA.
For r.in.usgs
set the product to ned for the National Elevation Dataset,
set the NED dataset to either 1 or 1/3 arcsecond,
and optionally set the resampling method to bilinear.
To work with lower resolution data
set the resolution of the region to 30m
with g.region
and import the national elevation dataset
at 1 arcsecond resolution with
r.in.usgs.
To work with higher resolution data
set the resolution of the region to 10m
with g.region
and import the national elevation dataset
at 1/3 arcsecond resolution with
r.in.usgs.
To better visualize the imported terrain data,
compute shaded relief with the module
r.relief
and then overlay the shaded relief and the digital elevation model with
r.shade.
g.region n=3432678.24028746 s=3420115.23940805 e=646814.51098306 w=634251.50105829 res=30 save=tunica_hills
g.extension extension=r.in.usgs
r.in.usgs product=ned output_name=elevation output_directory=usgs ned_dataset=ned1sec resampling_method=bilinear
r.relief input=elevation output=relief zscale=3
r.shade shade=relief color=elevation output=shaded_relief brighten=30
d.legend raster=elevation at=60,95,2,3.5 font=Lato-Regular fontsize=14
| Digital Elevation Model |
|---|
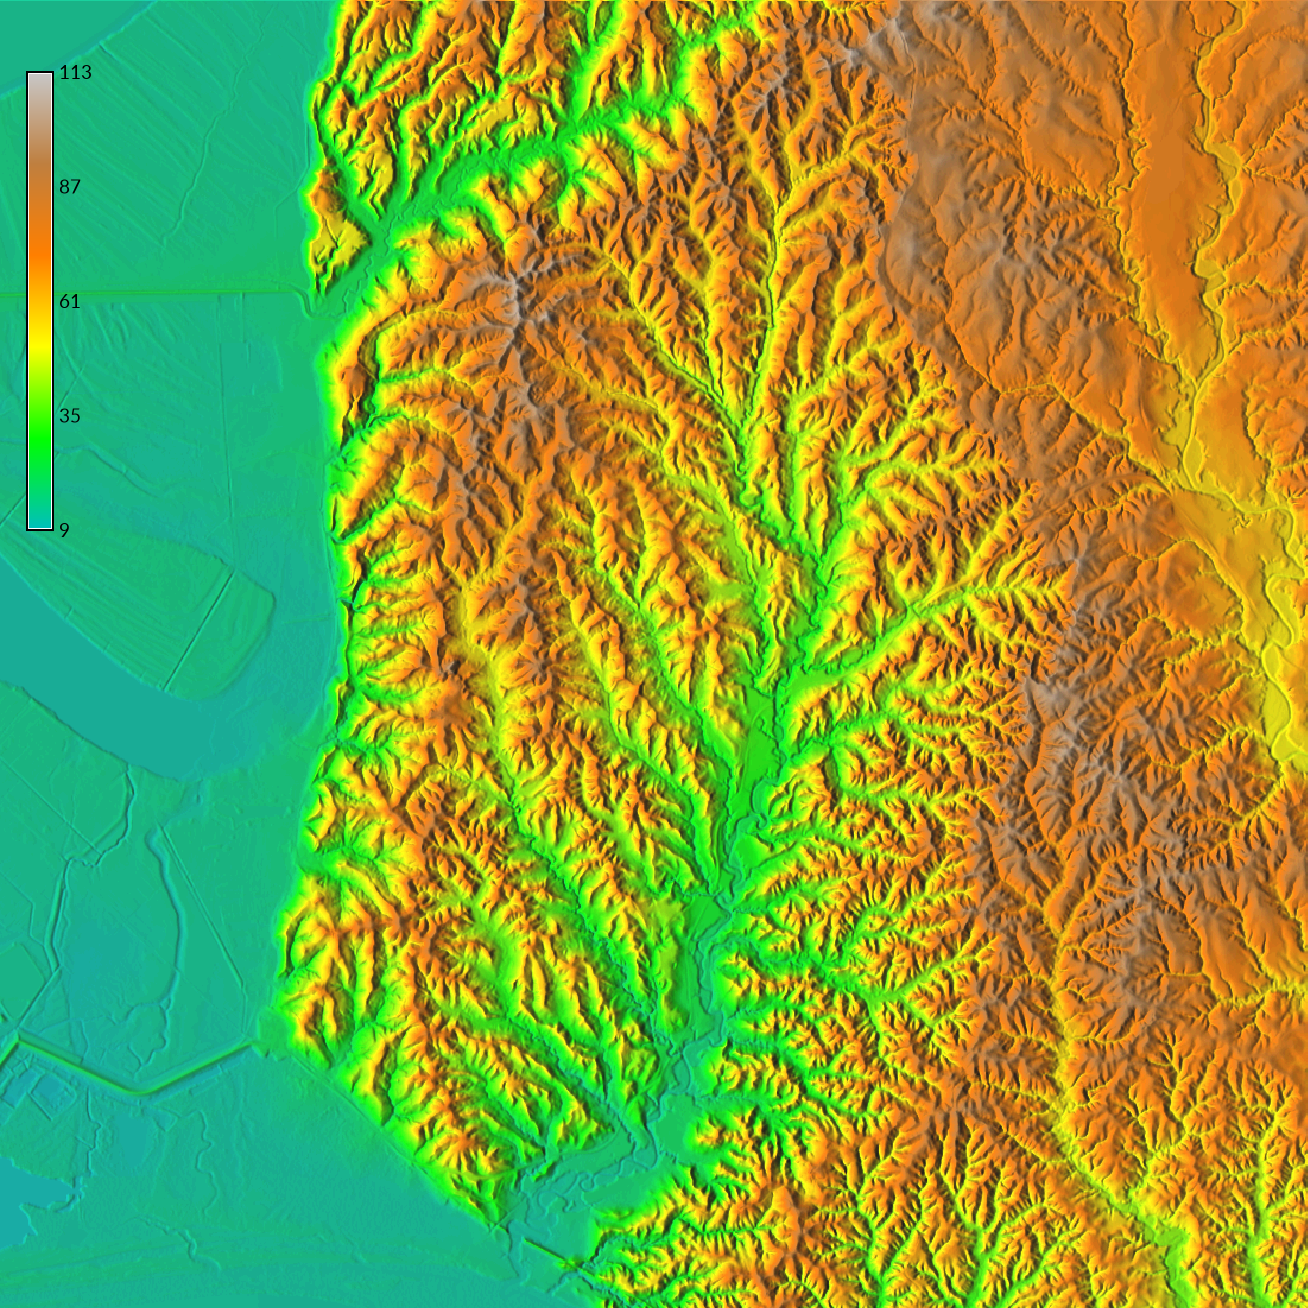 |
Watershed Delineation
A watershed is a region in which all of the surface water drains to an outlet. Watersheds are nested and vary in scale. A river basin can be subdivided into smaller watersheds for each of its streams. The watershed for each stream can be further subdivided into smaller watersheds for each its reaches and so forth. Watersheds can be computed from digital elevation models.
Compute the boundaries of this basin and its watersheds with the module
r.watershed.
Set a threshold to determine the minimum size of
(i.e. number of cells in) the watershed.
To model a large basin draining most of the study region
set the threshold to 10,000 cells
at 30 meter (i.e. 1 arcsecond) resolution.
If you are using a 1/3 arcsecond digital elevation model
at 10 meter resolution,
you will need to experiment to find the correct threshold value.
Convert the resulting raster map of basins to a vector map
with the module r.to.vect
and then extract the basin of interest with
v.extract
or the select vector features button.
r.watershed elevation=elevation threshold=10000 basin=basins
r.to.vect -s input=basins output=basins type=area
v.extract input=basins cats=3 output=basin
d.vect map=basin color=white fill_color=none width=3
To model watersheds for the larger streams within the basin, first set a raster mask to the vector map of the basin with r.mask and then run r.watershed with the threshold set to 1,000 cells at 30 meter resolution.
r.mask vector=basin
r.watershed elevation=elevation threshold=1000 basin=watersheds
r.to.vect -s input=watersheds output=watersheds type=area
d.vect map=watersheds color=white fill_color=none width=1
r.mask -r
| Watersheds |
|---|
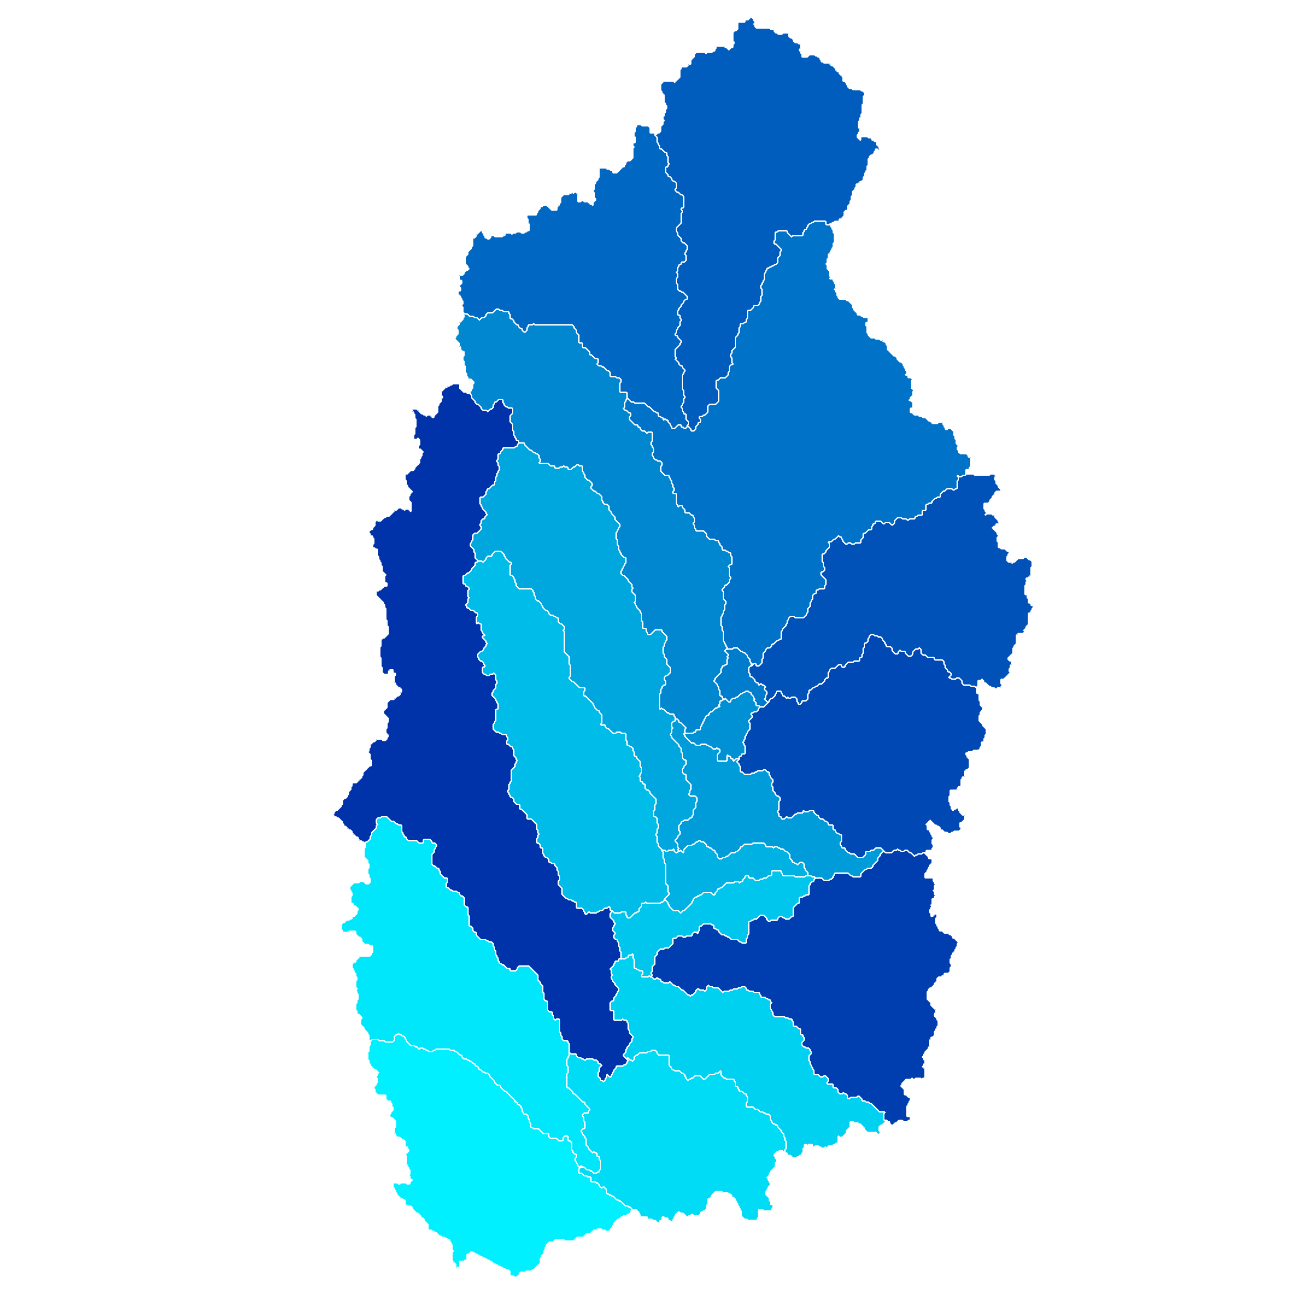 |
| Watersheds with Shaded Relief |
|---|
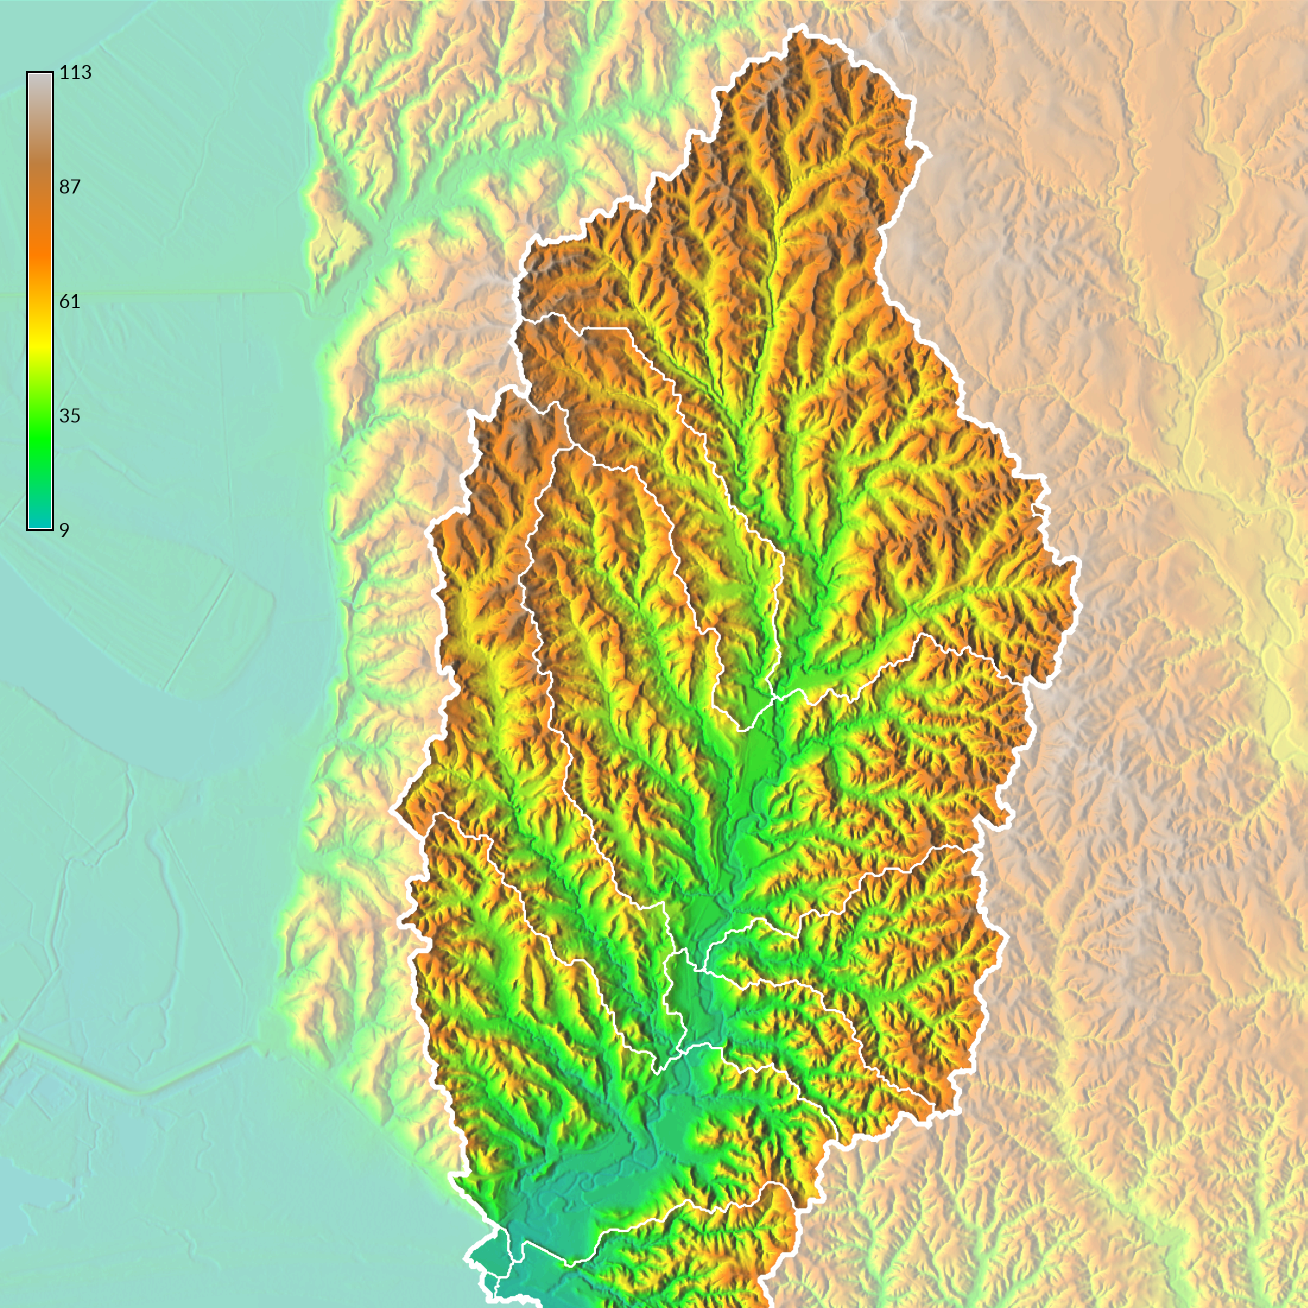 |
Optionally layer masked and unmasked shaded relief maps to visualize the topography inside and outside of the basin. First set the mask to the basin with r.mask, then with r.mapcalc use map algebra to create a masked version of the shaded relief. Remove the mask and set the opacity of the original shaded relief map to 50%.
r.mask vector=basin
r.mapcalc expression="masked_relief = shaded_relief"
r.mask -r
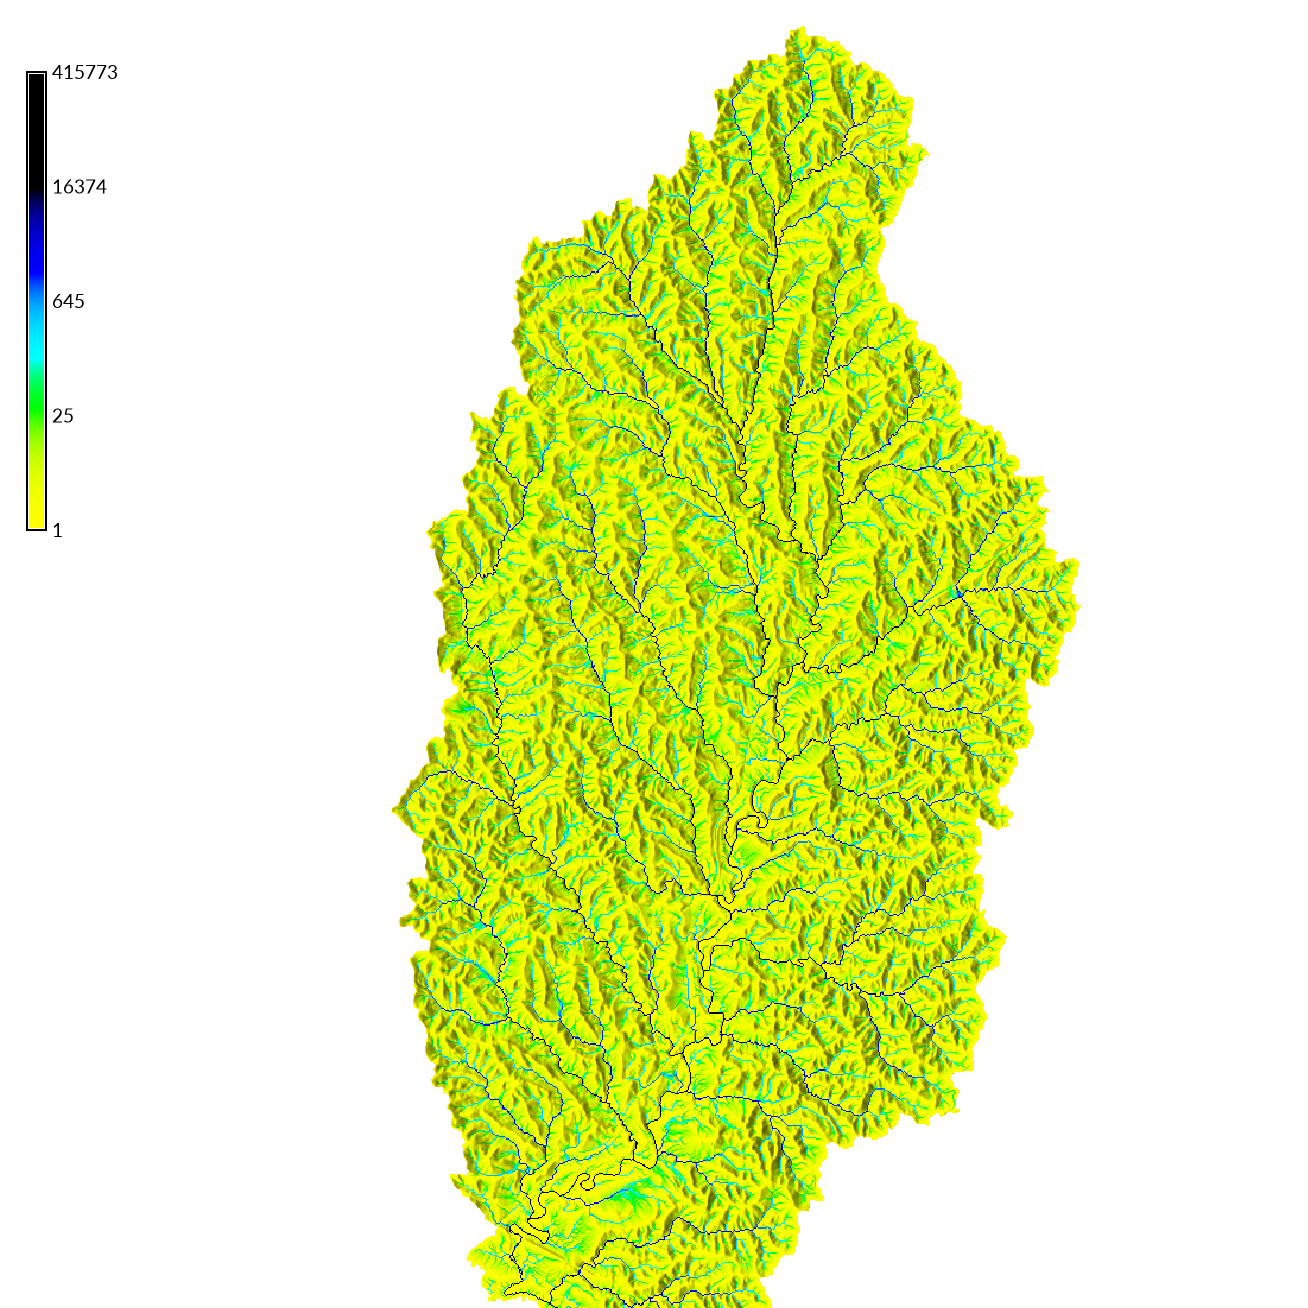
Flow Accumulation
Flow accumulation is number of cells that drain through each cell
and can be used to model stream networks.
Compute flow accumulation with
r.watershed.
Optionally set the -a and -b flags
to use positive flow accumulation and beautify flat areas.
To better visualize the flow accumulation,
drape it over the relief map with
r.shade.
Add a legend with the -l flag for logarithmic scaling.
r.mask vector=basin
r.watershed -a -b elevation=elevation threshold=10000 accumulation=flow_accumulation
r.shade shade=relief color=flow_accumulation output=shaded_accumulation brighten=80
d.legend -l raster=flow_accumulation at=60,95,2,3.5 font=Lato-Regular fontsize=14
| Flow Accumulation |
|---|
 |
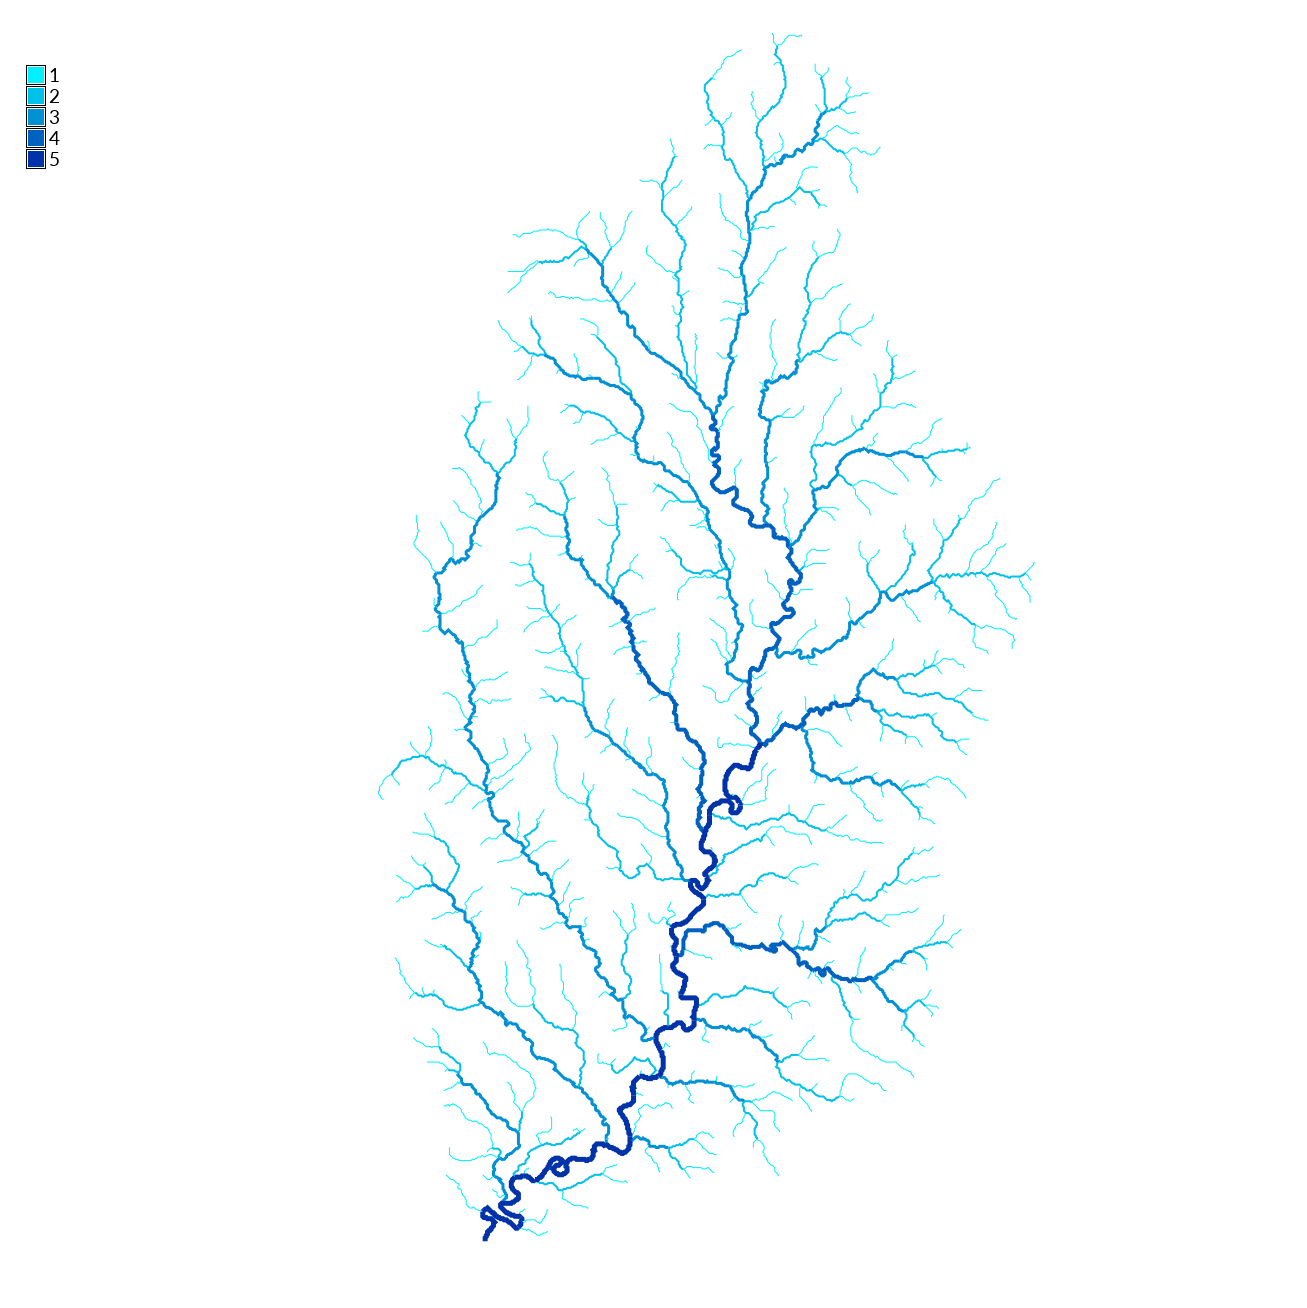
Stream Order
Use the r.stream family of modules to extract the stream network and compute the order of the streams. First extract the stream network from the flow accumulation with the module r.stream.extract. Generate raster maps of streams and flow directions. To extract only larger streams set the minimum threshold for flow accumulation to 200. Then use g.extension to install the addon module r.stream.order. Use the digital elevation model, flow accumulation, stream raster, and flow direction maps to compute stream order with r.stream.order. The resulting map of streams will have an attribute table describing the topology of the stream network including Strahler’s, Horton’s, Shreve’s, and Hack’s stream orders. To visualize stream order set the line weight of the vector map of streams to one of the stream order attributes in the table with d.vect. Set the symbol size to zero to hide the stream vertices. Optionally add a scale factor for the line width. Then set the color table to the same stream order attribute with v.colors.
r.stream.extract elevation=elevation accumulation=flow_accumulation threshold=200 stream_raster=stream_raster  direction=flow_direction
r.stream.order stream_rast=stream_raster direction=flow_direction elevation=elevation accumulation=flow_accumulation stream_vect=streams strahler=strahler
r.colors map=strahler color=water
d.vect map=streams width_column=strahler size=0
v.colors map=streams use=attr column=strahler color=water
d.legend raster=strahler at=85,95,2,3.5 font=Lato-Regular fontsize=14
| Strahler Stream Order |
|---|
 |
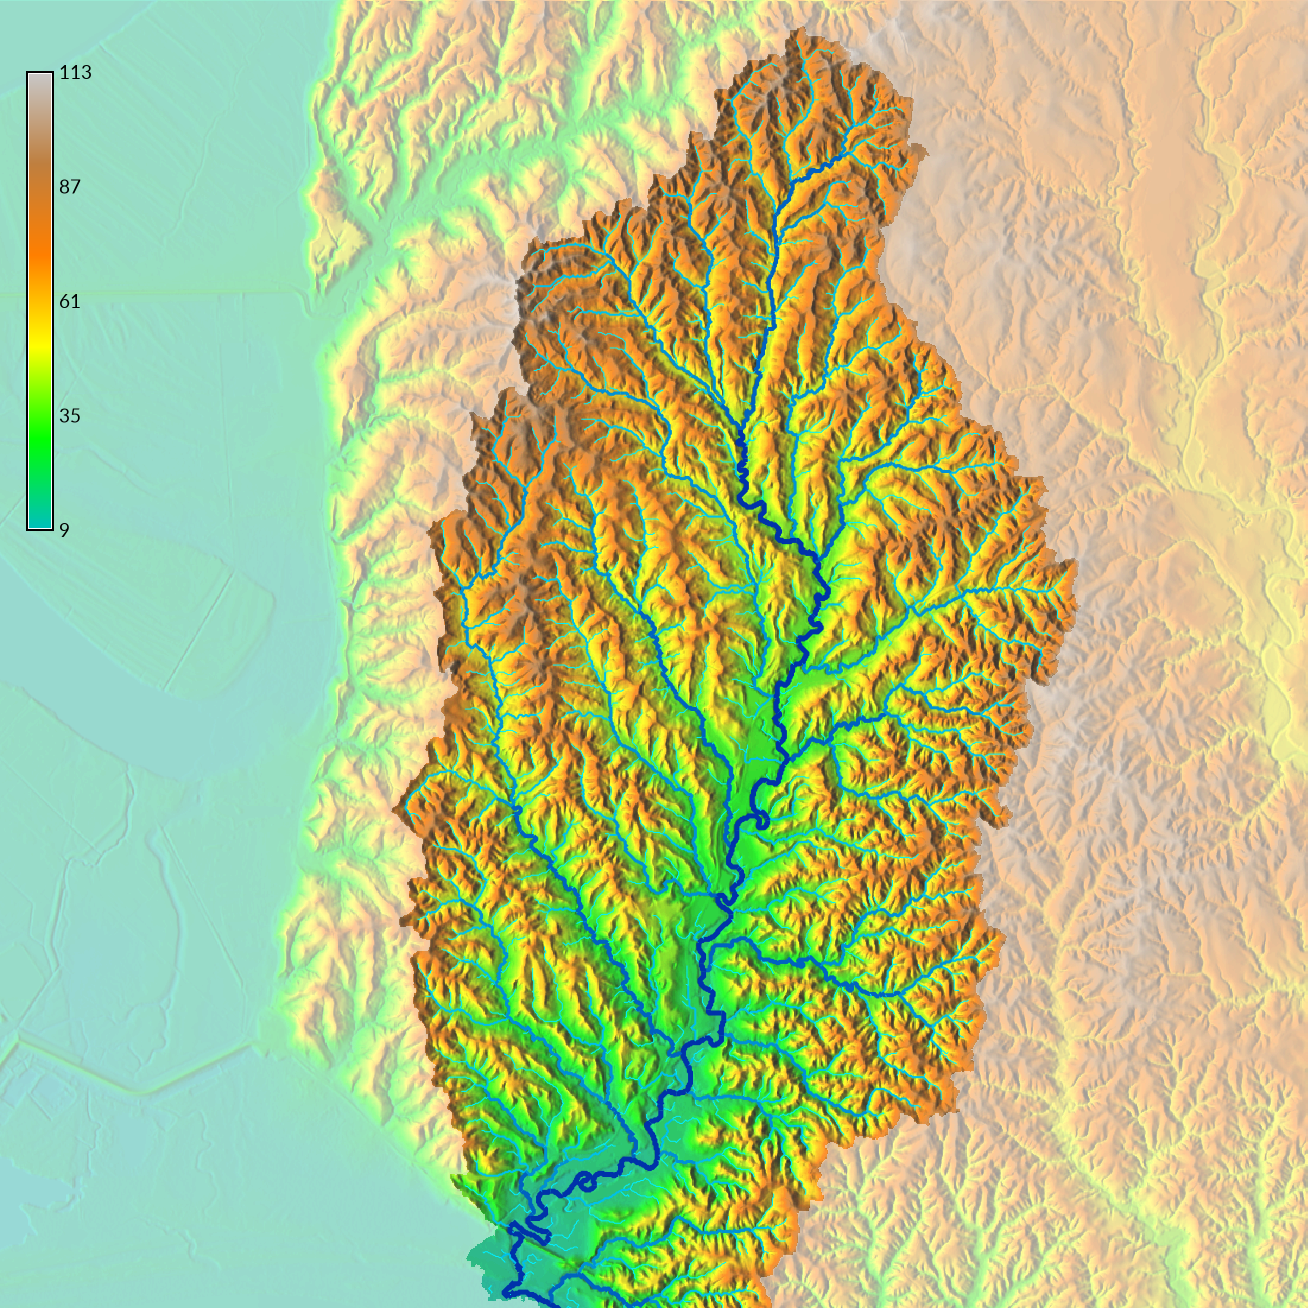
| Shaded Relief with Stream Network |
|---|
|
Data Sources
- National Elevation Dataset via the National Map
- Watershed Boundary Dataset via the National Map
- National Hydrography Dataset via the National Map
- NHDPlus High Resolution via the National Map