Acquiring Urban Data for GRASS GIS
Contents
- Data Sources
- Download Data for Governor’s Island
- Create New Location from Vector Data
- Process Vector Data for Governor’s Island
- Import Raster Data for Governor’s Island
- Download Data for Central Park
- Import Vector Data for Central Park
- Import Raster Data for Central Park
- Patch Raster Maps for Central Park
Data Sources
In this tutorial we will use geospatial data from GIS.NY.GOV and New York City’s Open Data portal. See my list of geospatial data sources for further sources of urban data.
Download Data for Governor’s Island
Download a digital elevation model (DEM)
and digital surface model (DSM)
for Governor’s Island, New York, NY, USA from
GIS.NY.GOV.
NYC commissioned a airborne lidar survey in 2017 and created
a 1 ft resolution bare earth DEM and a DSM from the lidar data.
The DEM represents the shape of the bare ground
with no trees, buildings, or other structures,
while the DSM represents the shape of the earth’s surface
and everything on it.
Large rasters such as these are often divided
into tiles for easier downloading.
For Governor’s Island download DEM and DSM tiles
using an FTP client:
be_NYC_020.tif and
hh_NYC_020.tif.
Alternatively
to download with your browser,
use these Google Drive links:
be_NYC_020.tif
and
hh_NYC_020.tif.
Also download and extract either
Tidally Coordinated Shoreline
or Shoreline
data from NYC Open Data.
For Shoreline
in the web mapping interface
select Export, Download, and then Original
to download Shoreline.zip.
Note:
If you choose Shapefile instead of Original
for Shoreline
you will download a reprojected version in a
geographic CRS in Latitude Longitude.
Create New Location from Vector Data
Start GRASS GIS.
In the startup screen, select New location.
In the Define new GRASS Location window,
first browse to set your GRASS GIS database directory
where the location will be created
and then set a name for the location.
Hit Next to continue.
Select Read projection and datum terms from a georeferenced data file.
Browse to select NYC_2017_LiDAR_Low_Tide_Shoreline.shp.
Hit Next and then Finish to continue.
Accept the Import data to import the data into the new location.
In the startup screen, select the new location
and the PERMANENT mapset and start the GRASS session.
Print information about the projection in the console with
g.proj
with the -p flag.
The map projection should be
NAD 1983 StatePlane New York Long Island FIPS 3104 Feet
in U.S. Surveyor’s Foot.
g.proj -p
Note:
Alternatively you can create a new GRASS location
for New York Long Island State Plane Feet
using the EPSG code 2263.
Process Vector Data for Governor’s Island
In the Map Display click the Select vector feature button.
Click on the shore of Governor’s Island to select it.
In the Select features dialog, click Create a new map.
Rename the map to shoreline using
g.rename.
Alternatively query the vector map to find
the category for Governor’s Island’s shore
and then use
v.extract
to extract it by category value.
v.extract input=NYC_2017_LiDAR_Low_Tide_Shoreline cats=184 output=shoreline
Or use an SQL query to select the category value.
v.extract input=NYC_2017_LiDAR_Low_Tide_Shoreline where="Cat = '184'" output=shoreline
Import Raster Data for Governor’s Island
Set the computational region and mask to the extracted shoreline for Governor’s Island.
g.region vector=shoreline res=1
r.mask vector=shoreline
Then import the DEM and DSM with the module
r.in.gdal
with the -r flag to limit the import the region.
r.in.gdal -r input=be_NYC_020.tif output=elevation_2017
r.in.gdal -r input=hh_NYC_020.tif output=surface_2017
Note: When you want to import data in a different projection into a location, use r.import to import with automatic reprojection.
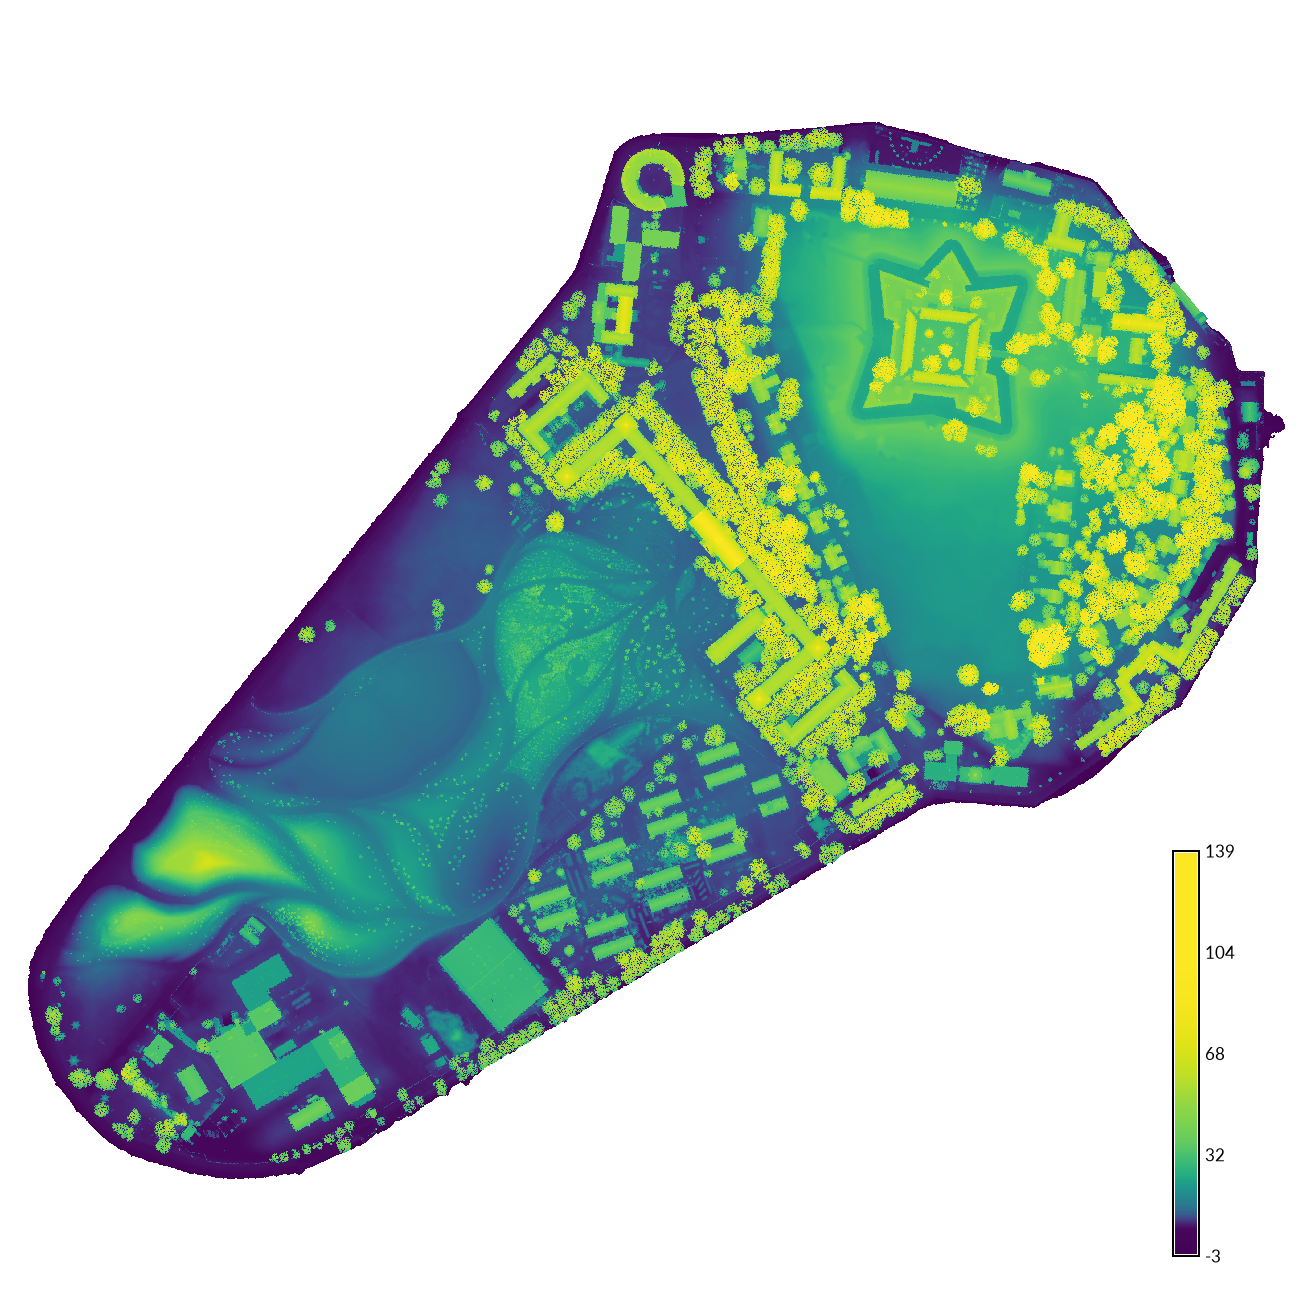
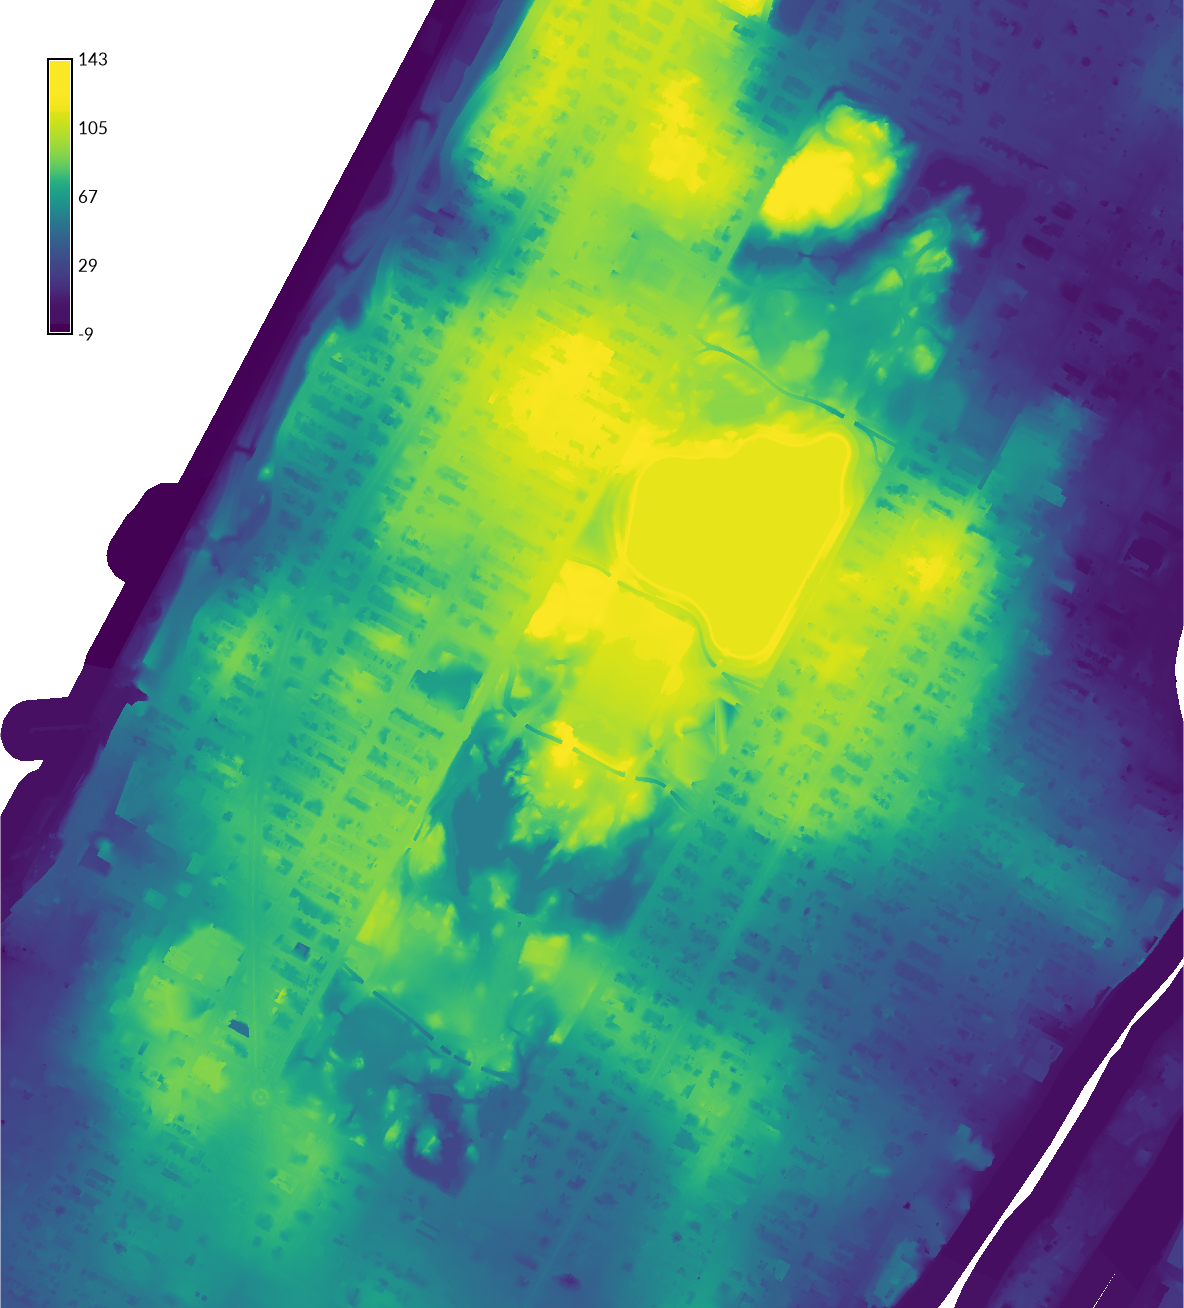
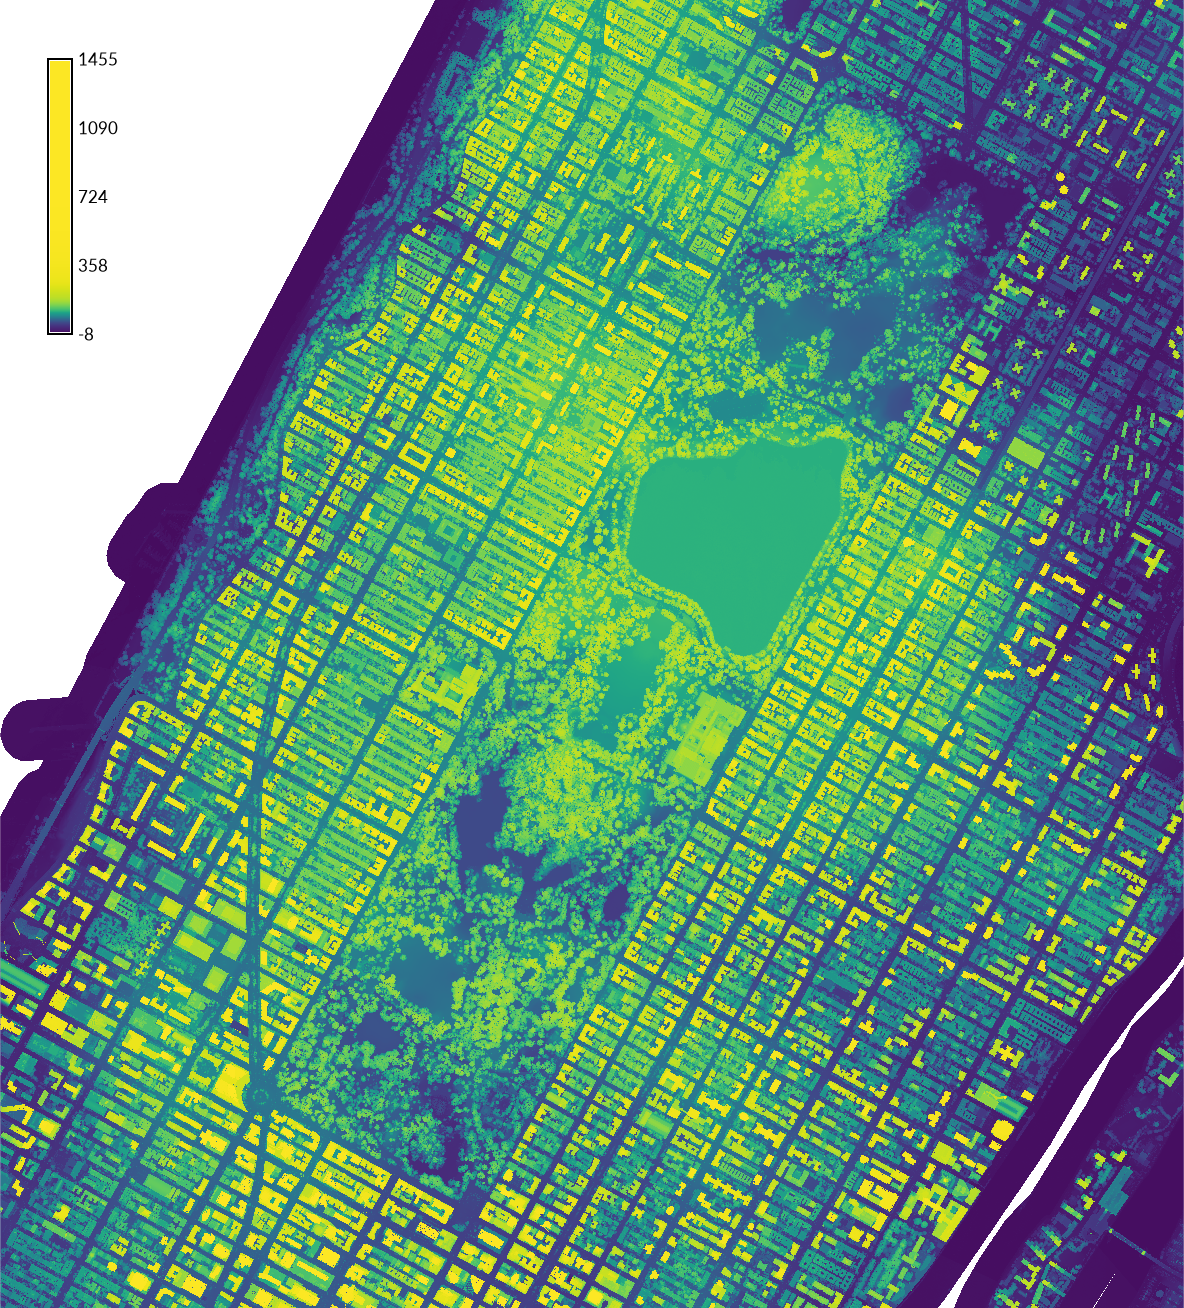
Set a color table for each raster map using r.colors. Add a legend with d.legend.
r.colors -e map=elevation_2017 color=viridis
r.colors -e map=surface_2017 color=viridis
| Digital elevation model | Digital surface model |
|---|---|
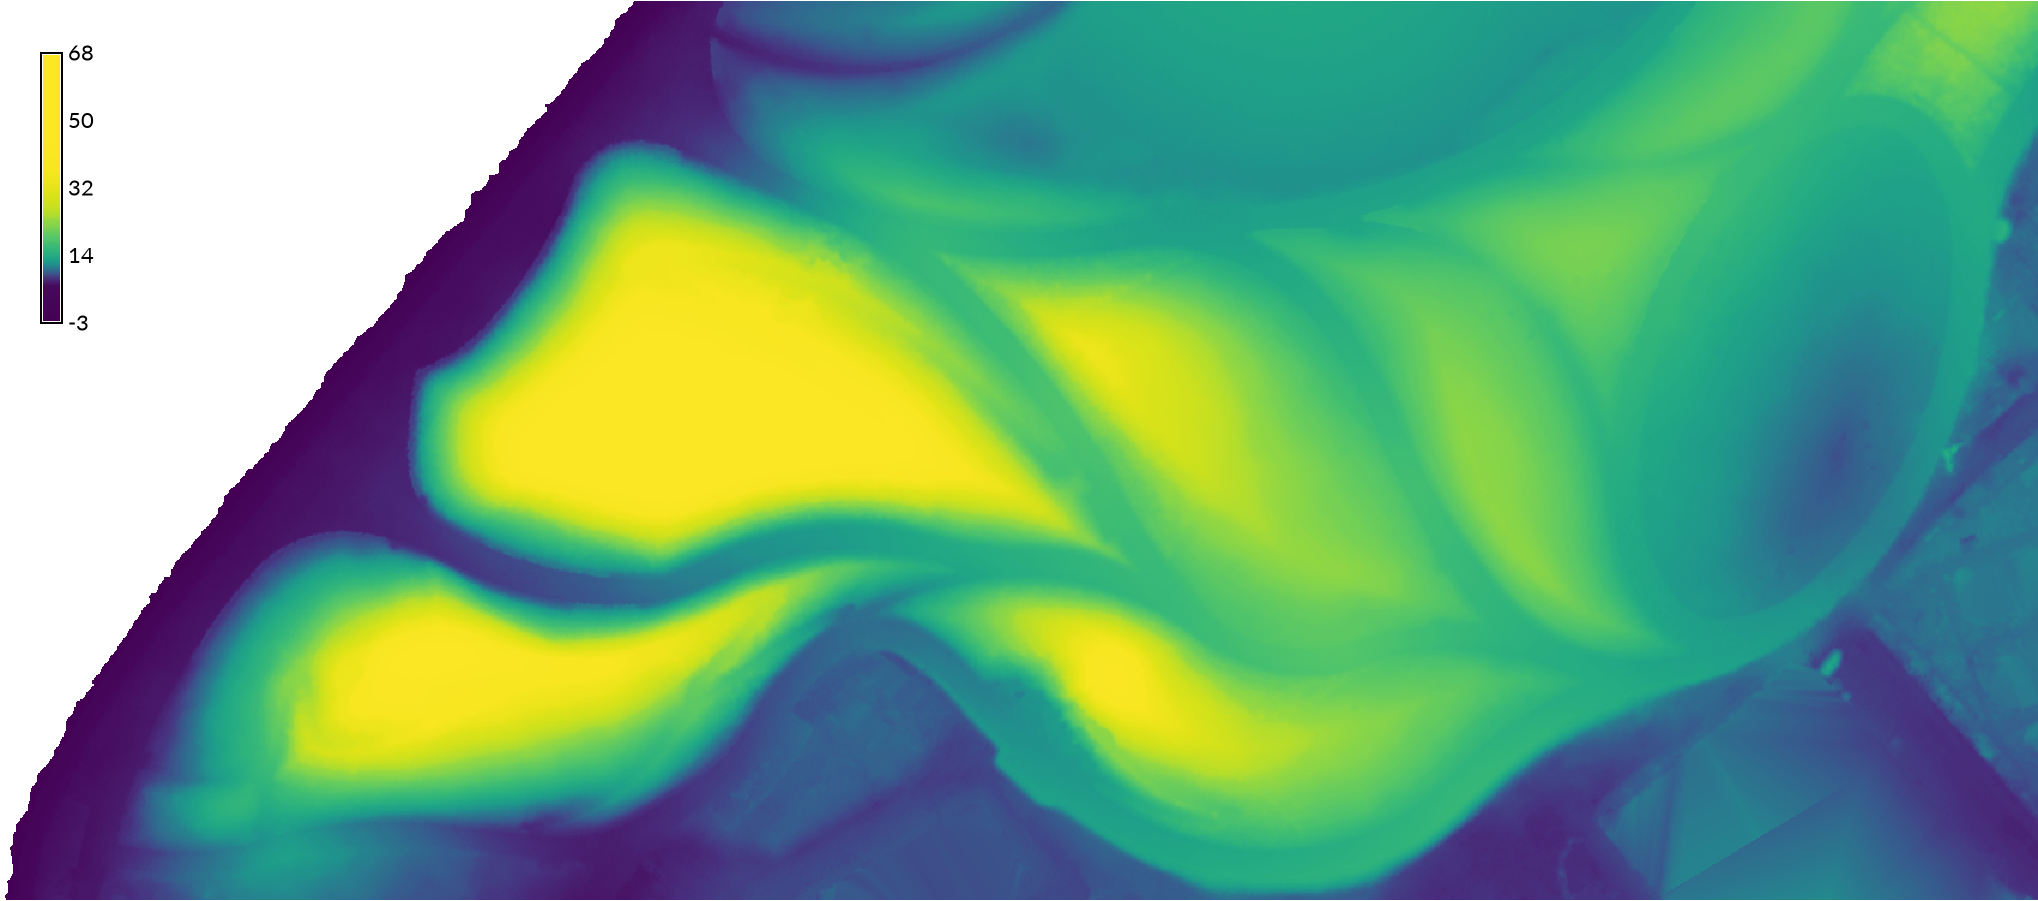 |
|
Download Data for Central Park
For practice, download and import geospatial data for Central Park in New York City. Download the Landcover 2017 geotiff and Open Space shapefile from the NYC Open Data portal. For the Open Space data, in the Export menu select Download Original to download the PARK.zip archive containing PARK.shp in New York Long Island State Plane in U.S. Surveyor’s Feet. (Other export options may be in Lat Long instead.) Check https://orthos.dhses.ny.gov/ to determine which DEM tiles to download for Central Park. Then download the NYC Topobathymetric 2017 DEM (be_NYC_025.tif & be_NYC_029.tif) and NYC Topobathymetric 2017 DSM (hh_NYC_025.tif & hh_NYC_029.tif) tiles from GIS.NY.GOV. Optionally download orthoimagery tiles from 2006, 2008, 2012, and 2016 for Central Park at https://orthos.dhses.ny.gov/.
Import Vector Data for Central Park
Create a new location called nyspf_central_park
from PARK.shp.
Then start GRASS GIS.
In the startup screen, select New location.
In the Define new GRASS Location window,
first browse to set your GRASS GIS database directory
where the location will be created
and then set a name for the location.
Hit Next to continue.
Select Read projection and datum terms from a georeferenced data file.
Browse to select PARK.shp.
Hit Next and then Finish to continue.
Accept the Import data to import the data into the new location.
In the startup screen, select the new location
and the PERMANENT mapset and start the GRASS session.
Extract Central Park from the PARK vector map
either by selecting the feature
or running v.extract.
In the Map Display click the Select vector feature button.
Click on the polygon bounding Central Park to select it.
In the Select features dialog, click Create a new map.
Then rename the map to central_park using
g.rename.
Alternatively use
v.extract
with an SQL query of park names in the attribute table.
v.extract input=PARK where="PARK_NAME = 'Central Park'" output=central_park
Then delete the PARK vector map using
g.remove
with flag -f to force the removal of the map.
g.remove type=vector name=PARK
Import Raster Data for Central Park
Set your computational region to the new central_park vector map
at 1 foot resolution and the save the region.
This will limit the scope of all raster operations
to our study area in central park.
g.region vector=central_park res=1 save=central_park
Or zoom to an extent containing Central Park, set the computational region extent from the display, and save the region.
g.region res=1 save=central_park
Import the tiles of digital elevation and digital surface models using
r.in.gdal
with the -r flag to limit the import the region.
r.in.gdal -r input=be_NYC_025.tif output=elevatione_2017_a
r.in.gdal -r input=be_NYC_029.tif output=elevation_2017_b
r.in.gdal -r input=hh_NYC_025.tif output=surface_2017_a
r.in.gdal -r input=hh_NYC_029.tif output=surface_2017_b
Note that the color ramps for the pairs of tiles do not match. Each pair of tiles needs to be patched together.
| Elevation Raster Tiles | Surface Raster Tiles |
|---|---|
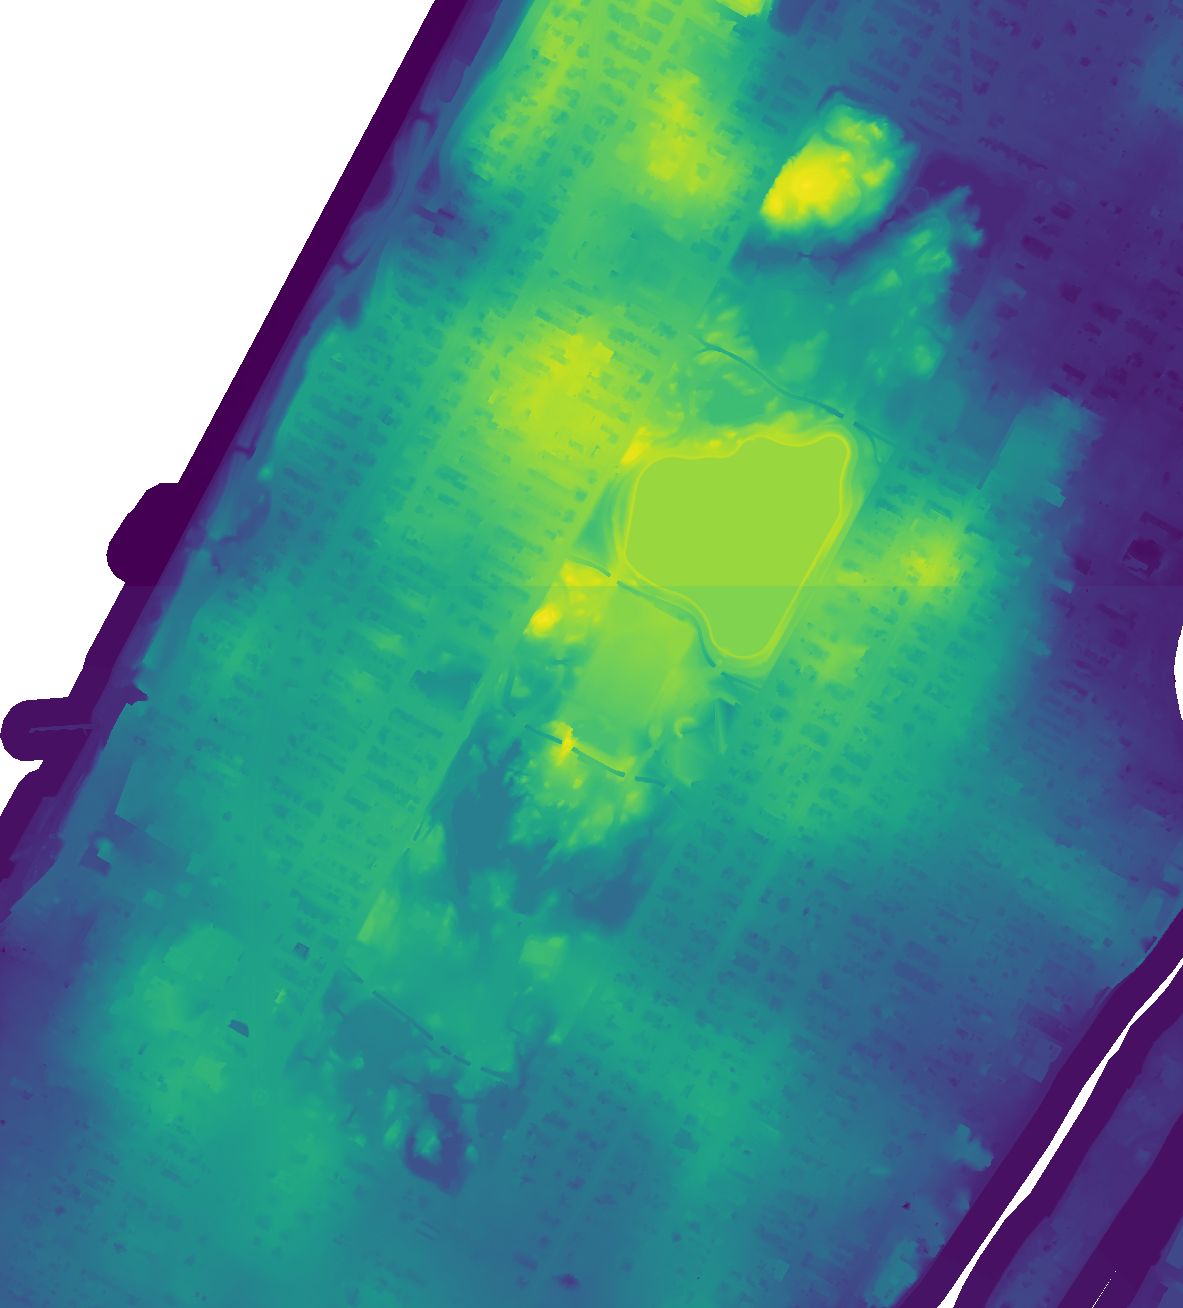 |
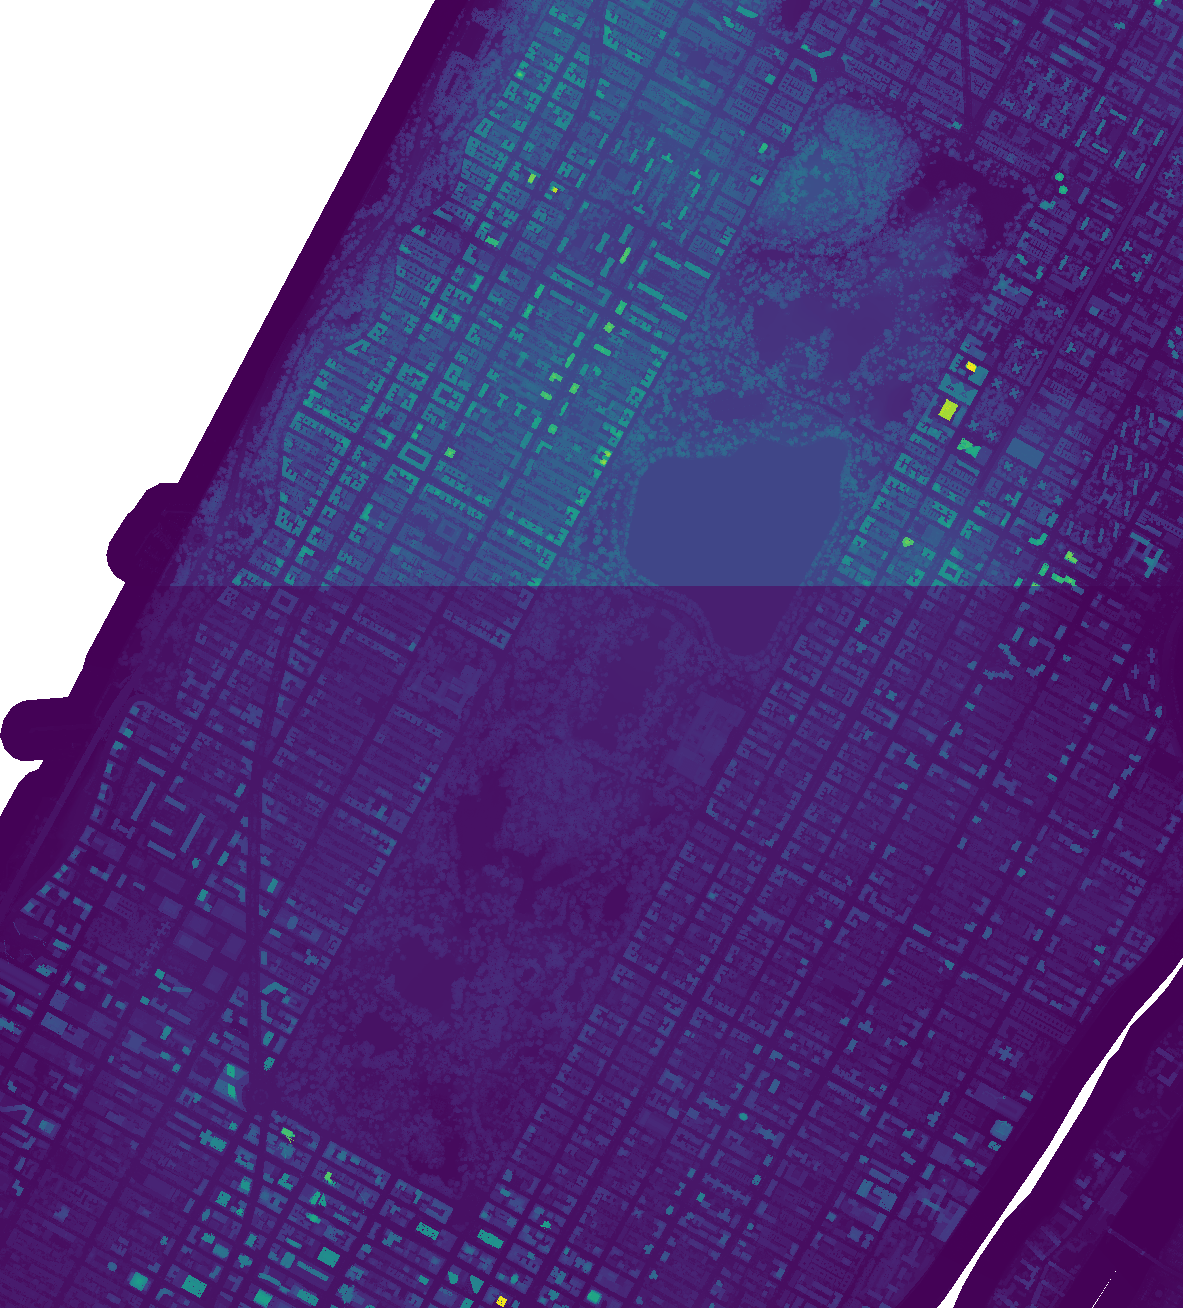 |
Patch Raster Maps for Central Park
Patch the two tiles of the digital elevation and digital surface models together with the module r.patch.
r.patch input=elevation_2017_a,elevation_2017_b output=elevation_2017
r.patch input=surface_2017_a,surface_2017_b output=surface_2017
Remove both original pairs of raster tiles with
g.remove
with flag -f.
g.remove -f type=raster name=elevation_2017_a,elevation_2017_b,surface_2017_a,surface_2017_b
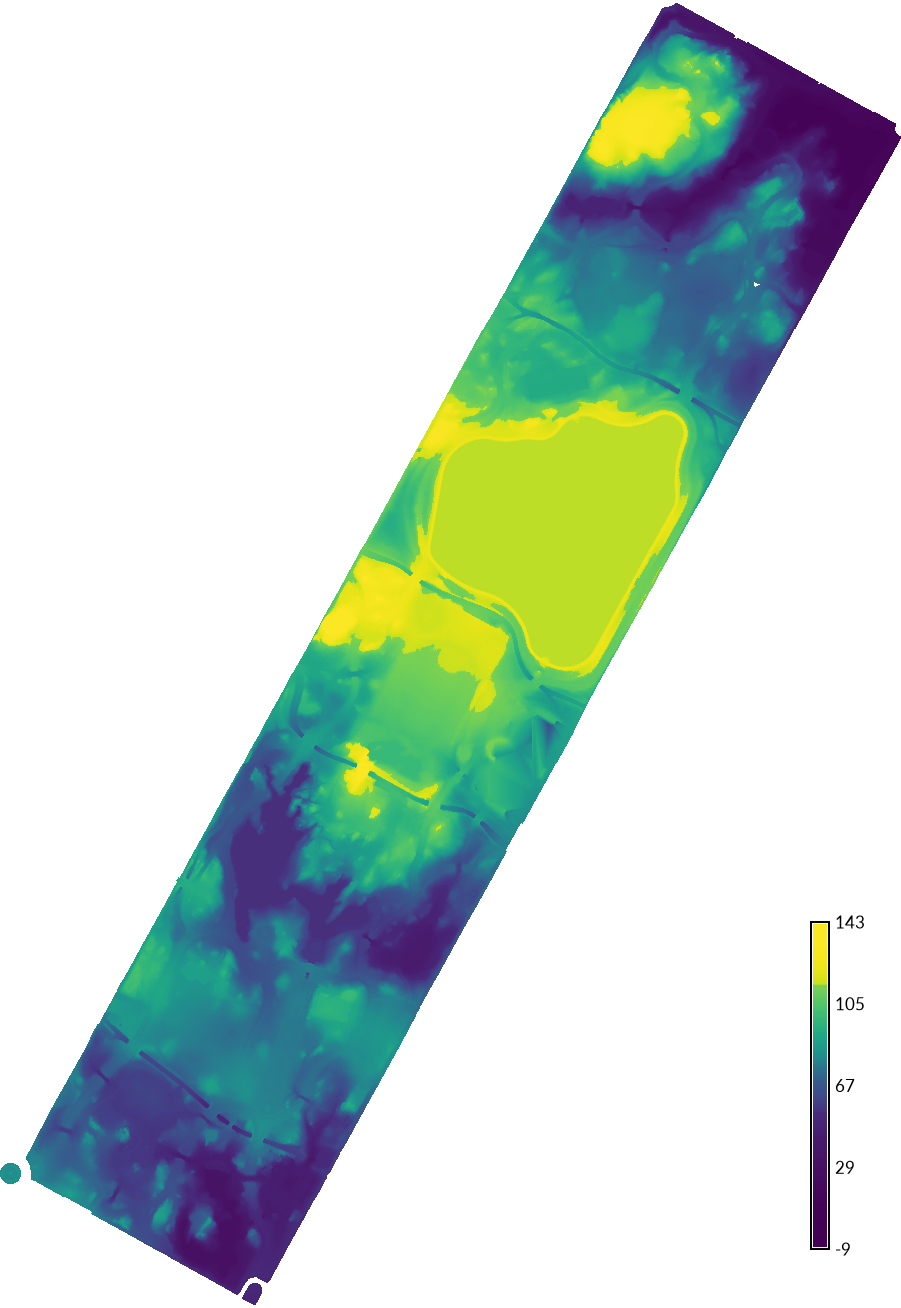
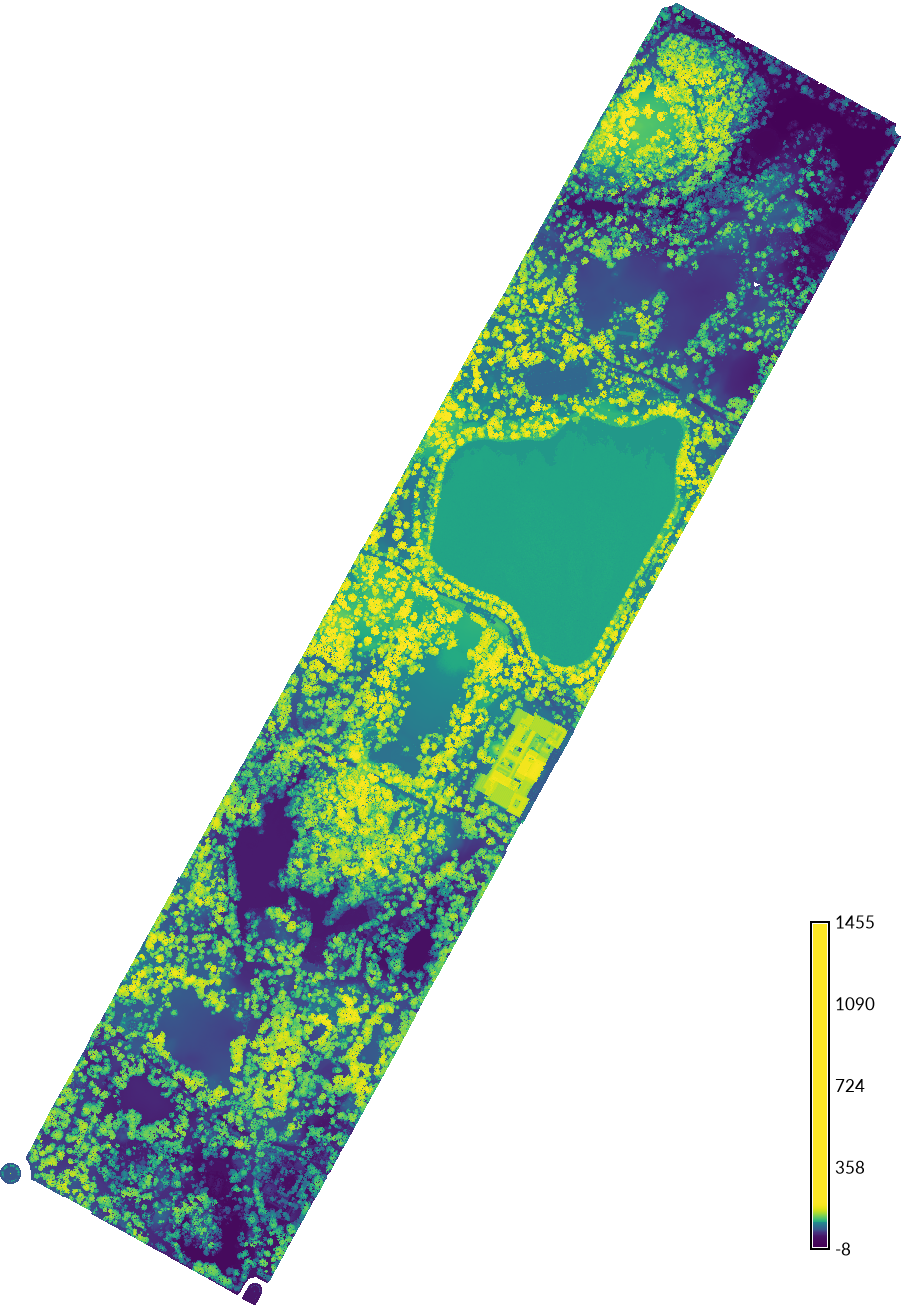
Set a color table for each raster map using
r.colors.
Add a legend with
d.legend.
Then Save .png images using the save display to file button.
r.colors -e map=elevation_2017 color=viridis
r.colors -e map=surface_2017 color=viridis
d.legend raster=elevation_2017 at=75,96,4,6 font=Lato-Regular fontsize=12
d.legend raster=surface_2017 at=75,96,4,6 font=Lato-Regular fontsize=12
| Digital Elevation Model, Central Park | Digital Surface Model, Central Park |
|---|---|
 |
 |
Optionally set a mask to the central_park vector map.
r.mask vector=central_park
| Digital Elevation Model, Central Park | Digital Surface Model, Central Park |
|---|---|
 |
 |