Terrain Modeling
A Gentle Introduction to Terrain Modeling with Grasshopper
Contents
Overview
This tutorial is a gentle introduction to terrain modeling with Grasshopper. The tutorial begins with a brief guide to the basics of Rhino’s visual programming interface, Grasshopper. Then it covers how to import, model, grade, and analyze terrain using the Docofossor plugin. Materials for this tutorial include videos, a dataset, and an example:
Videos: Terrain Modeling & Grading Terrain.
Dataset: governors-island-landform.xyz
Visual Programs: fundamentals.gh & topographic-modeling.gh
Plugin: Docofossor
Fundamentals of Grasshopper
Grasshopper is a visual programming interface for the 3D modeling program Rhinoceros. With visual programming, you can algorithmically generate geometry by composing diagrams that link data to functions. An algorithmic approach enables designers to create complex forms and rapidly generate alternative designs.
This part of the tutorial covers how model basic geometry -
such as points, lines, meshes, and surfaces - in Grasshopper.
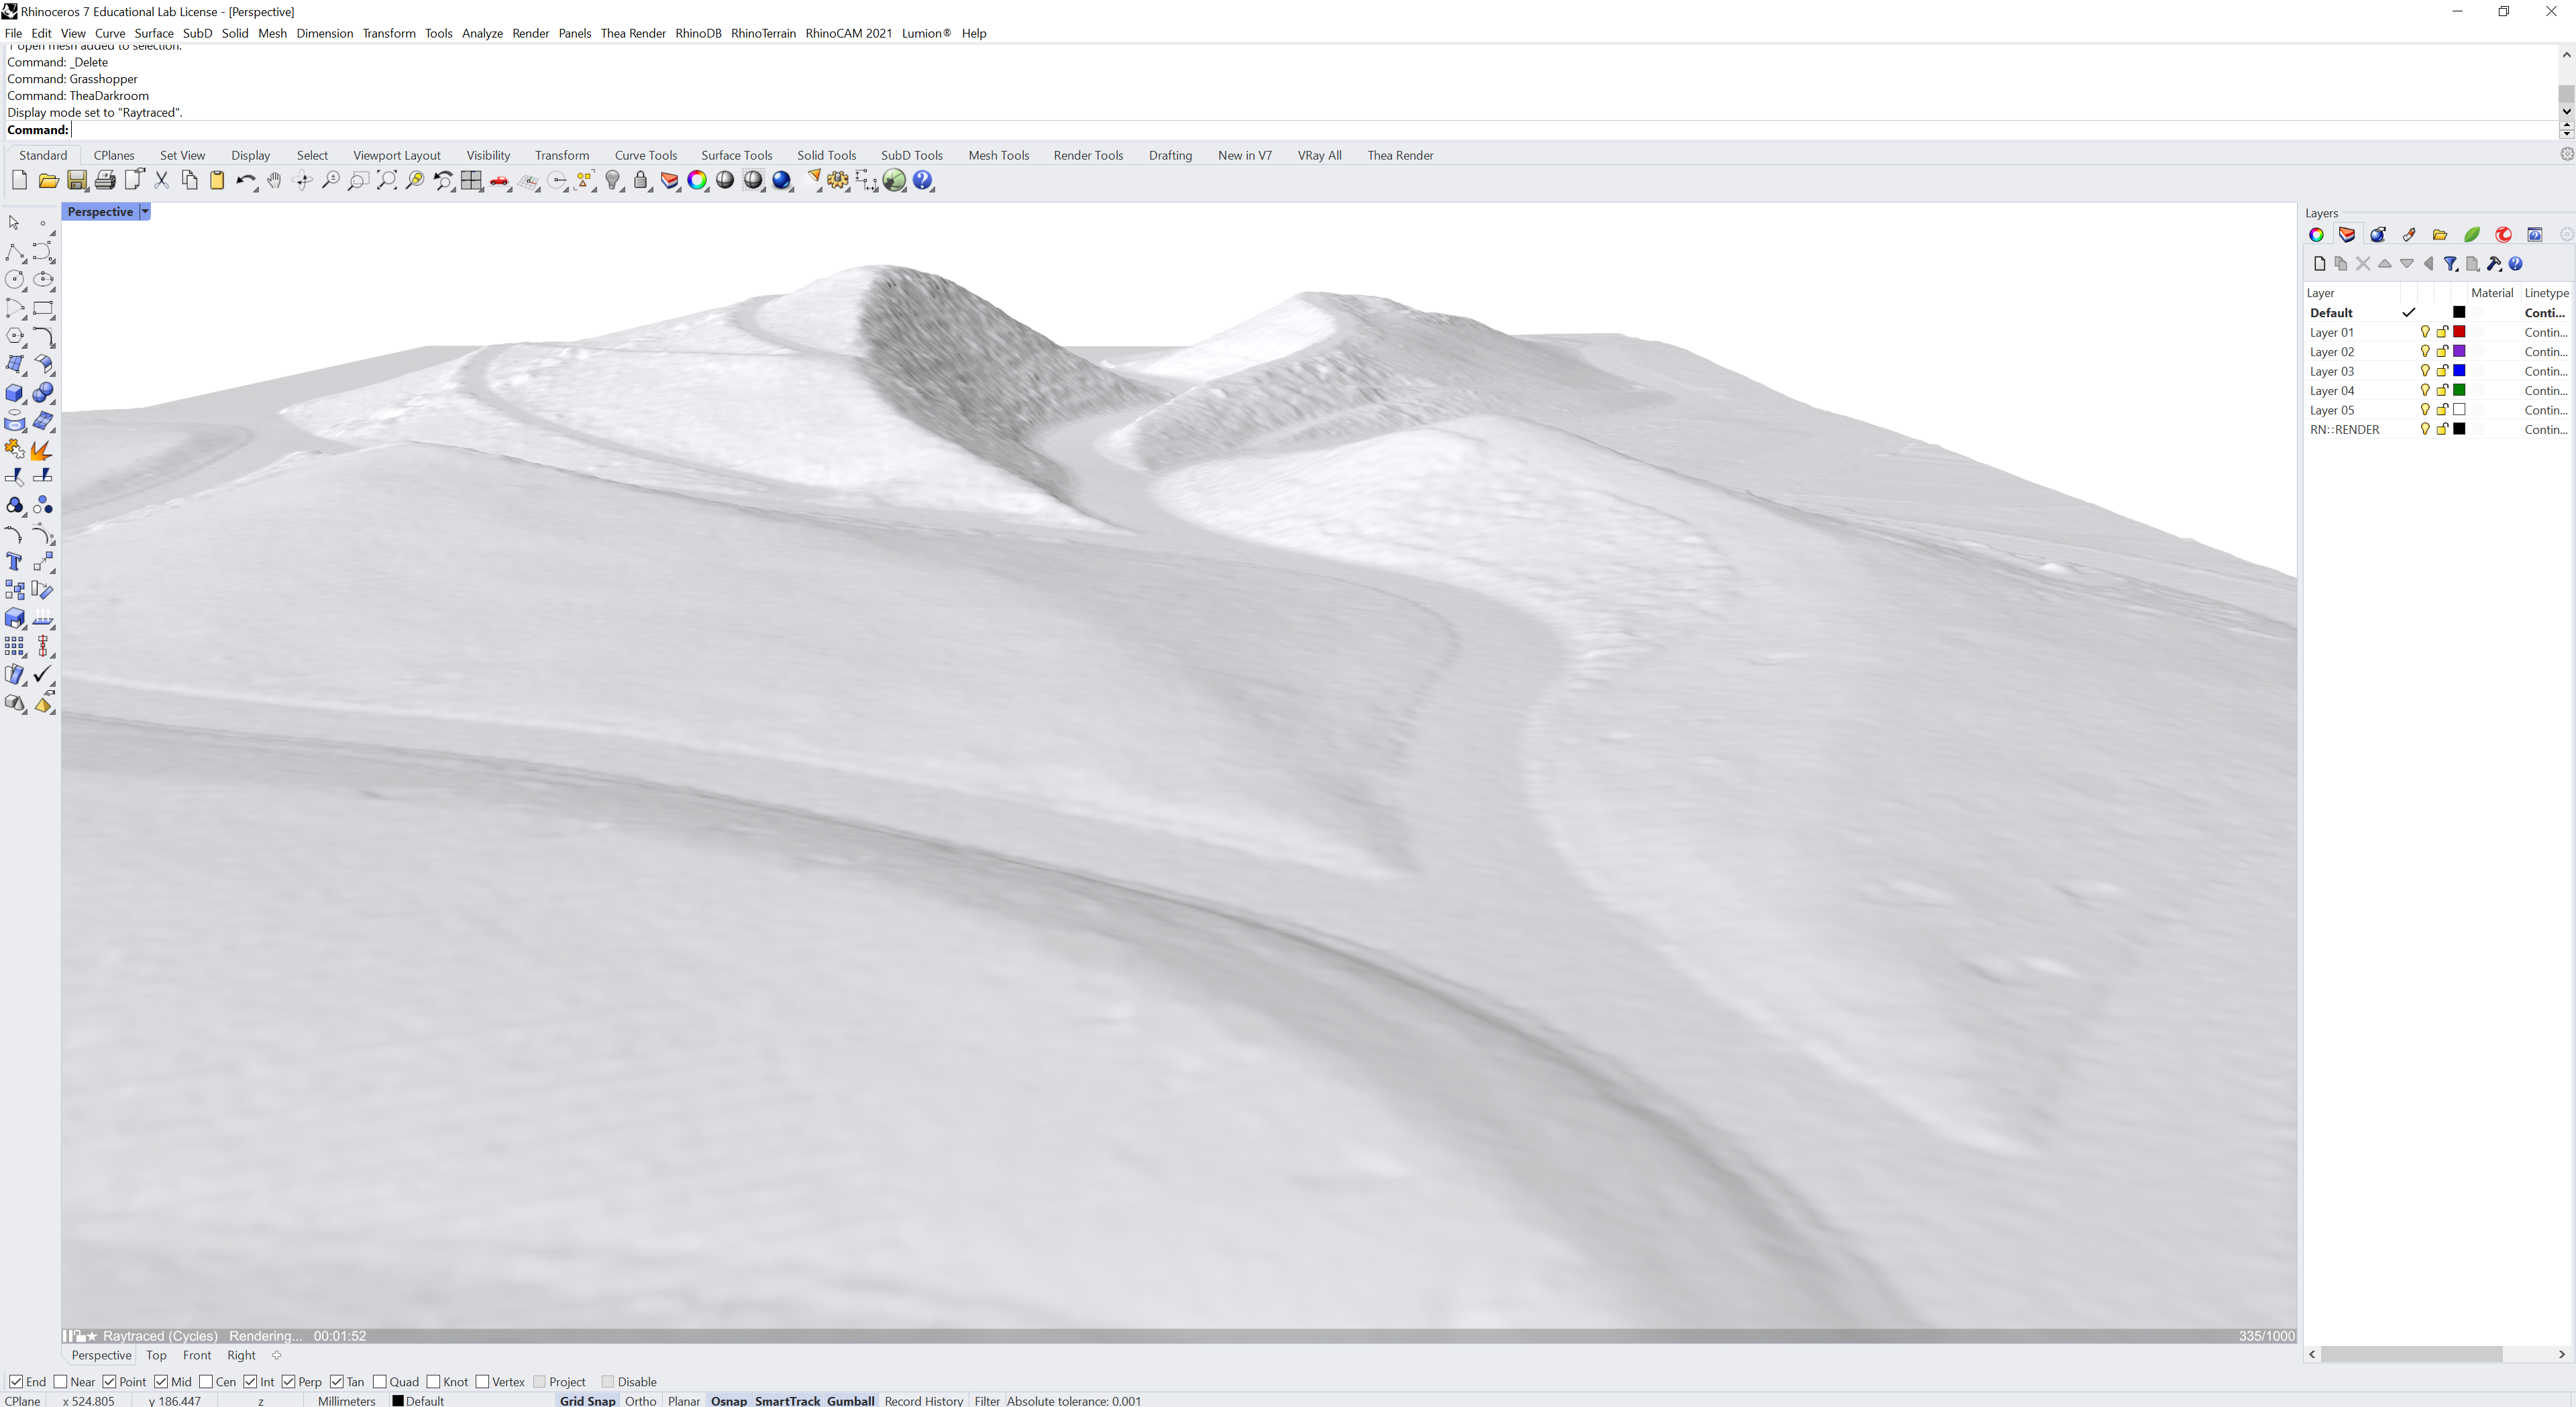
First start Rhino.
Type grasshopper in the Rhino’s command line
to launch the visual programming interface.
The Grasshopper interface has a menu bar,
a toolbar with parameters and components,
and a canvas for composing diagrams.
Parameters are used to set and store data.
Components are functions for performing operations.
Drop parameters and components on the canvas
and connect them together with wires
to create node based diagrams
that generate geometry in Rhino.
A visual programming diagram composed in Grasshopper
generates geometry in Rhino.
Grasshopper’s visual programs are called definitions.
Download the example definition
very-basics.gh
as a guide for this section.
Points
In Cartesian space a point
is defined by x, y, and z coordinates.
In Grasshopper points can either be
constructed from x, y, and z coordinates or
drawn in Rhino and referenced in Grasshopper.
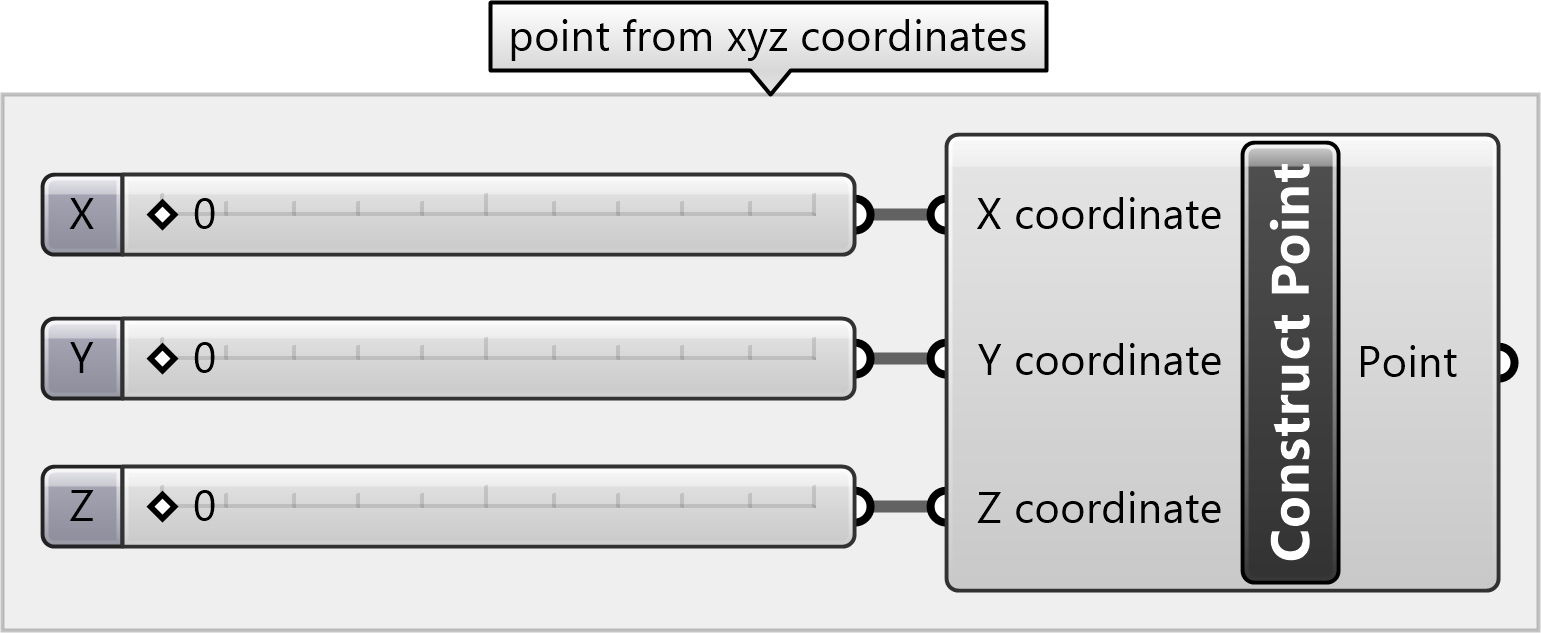
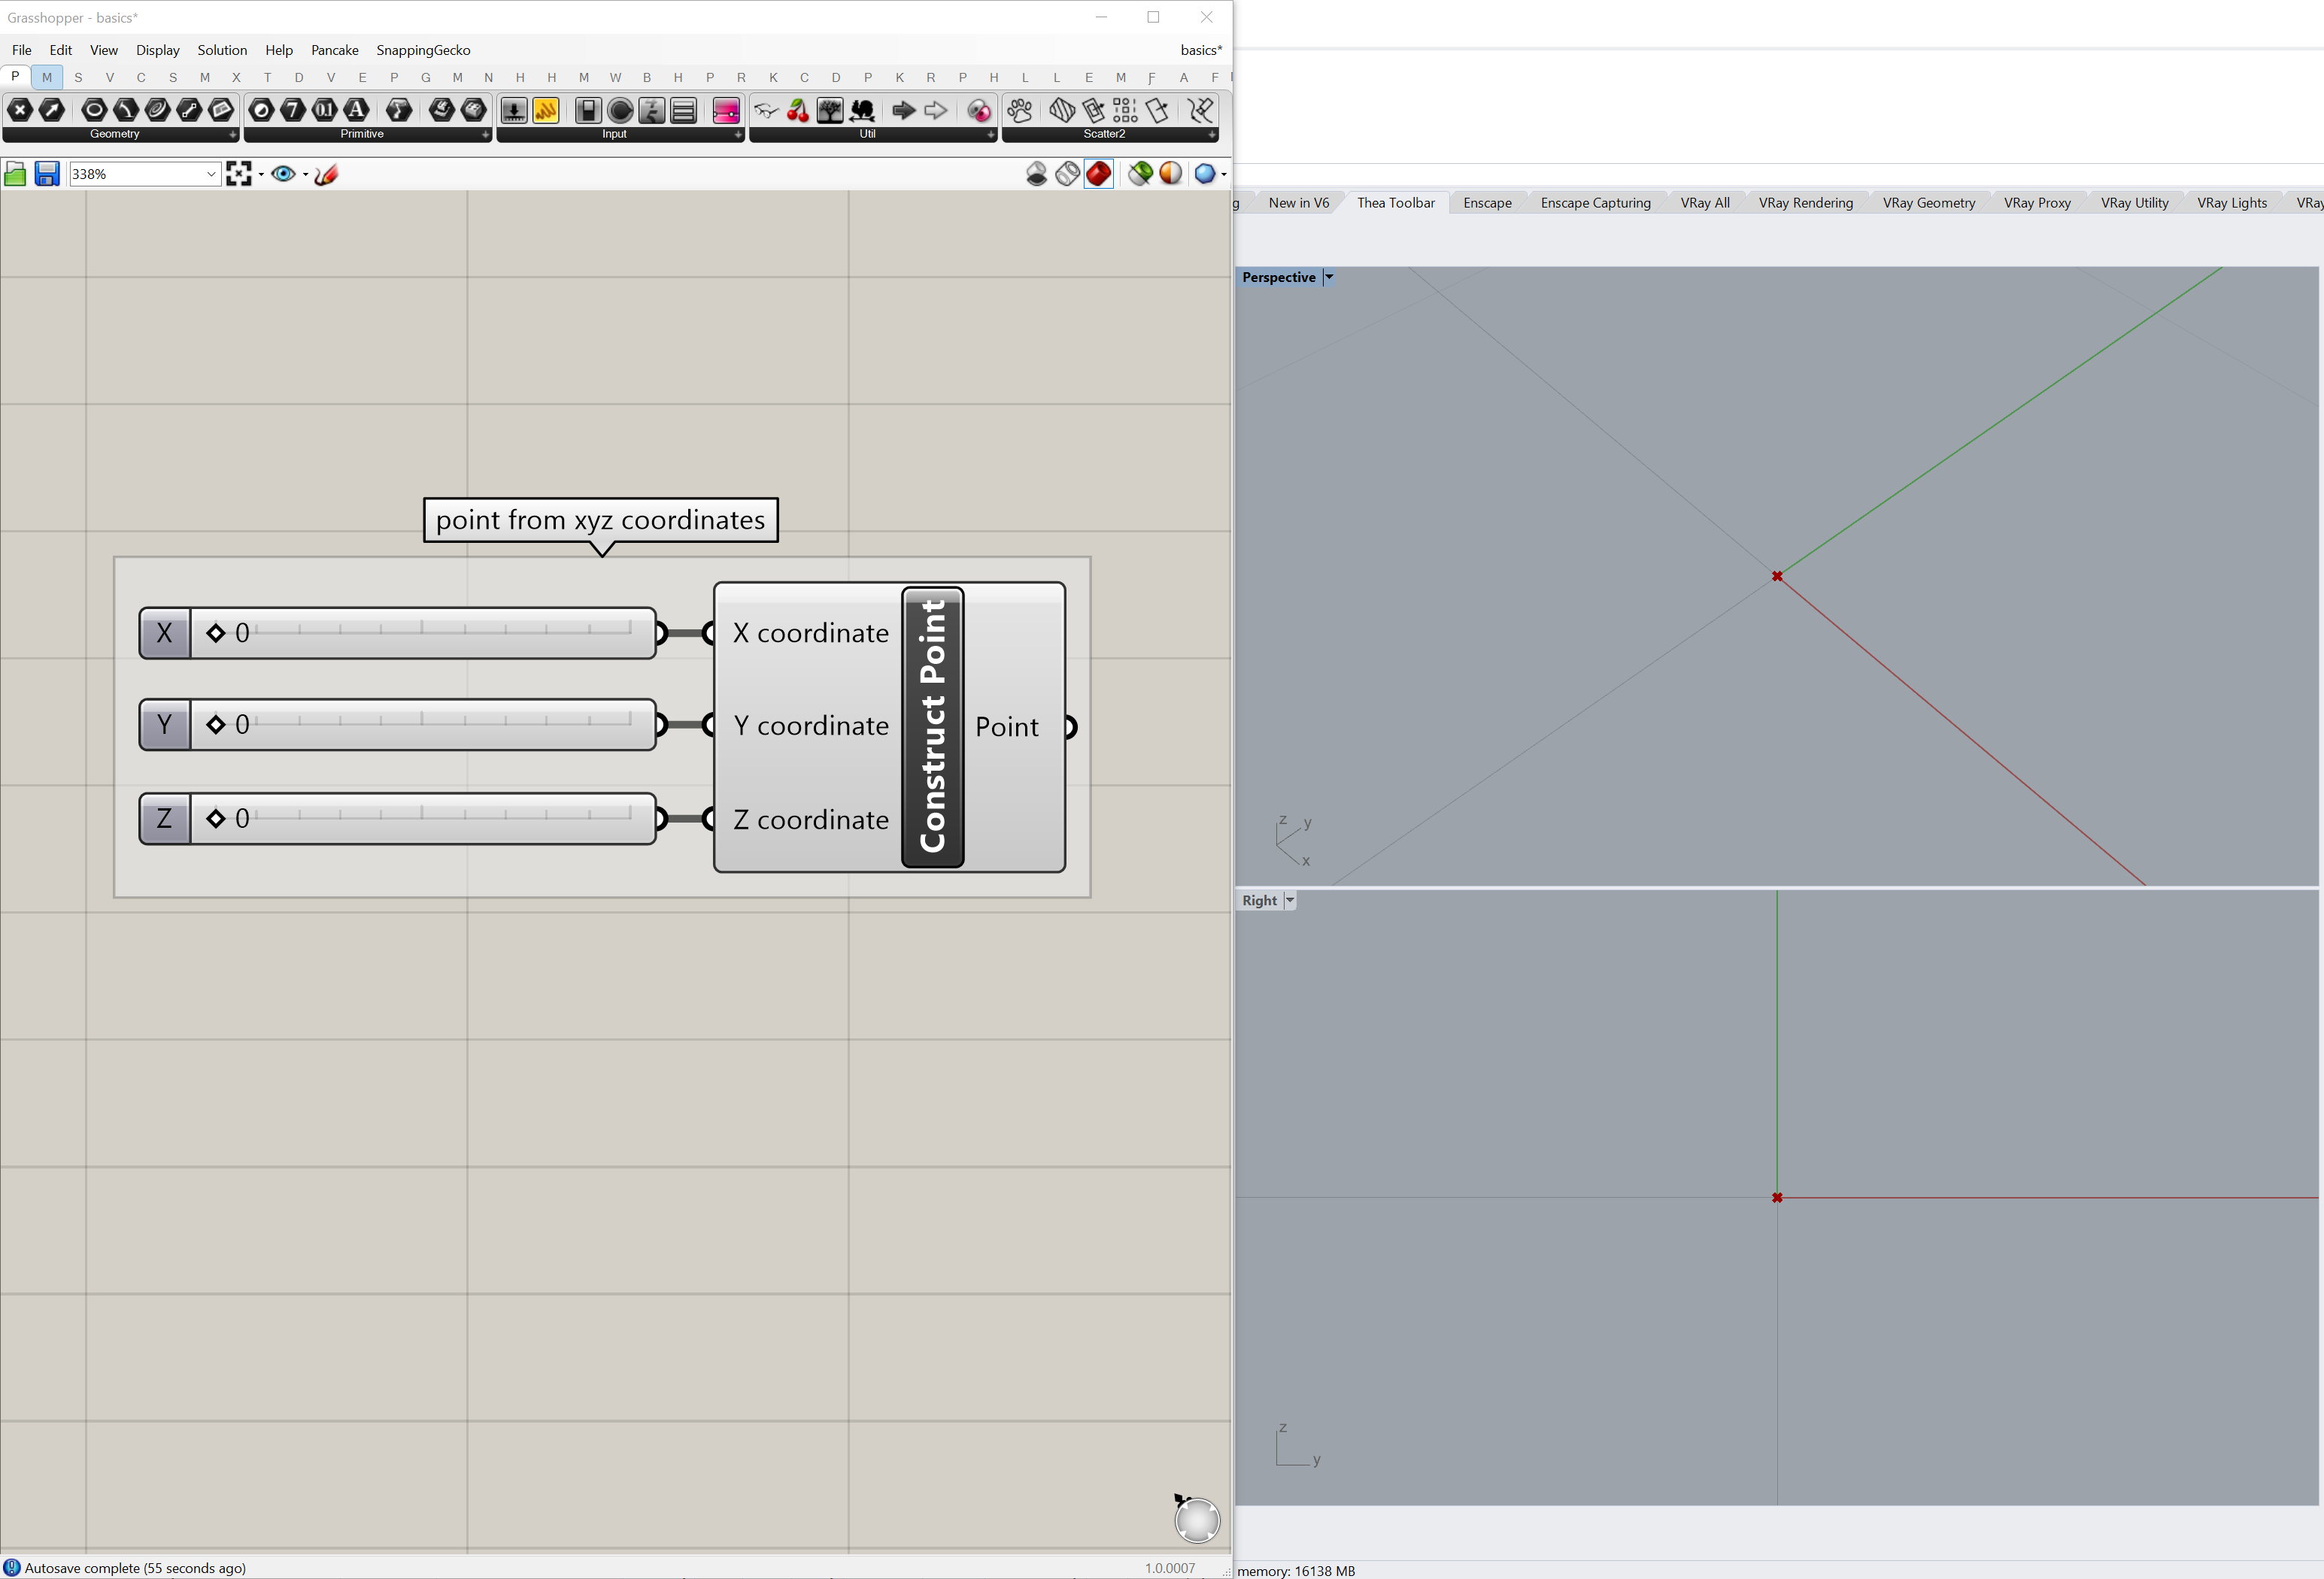
One way to define a point is with the
Construct Point
component.
Find the Construct Point component
in the Points panel of the Vector tab.
Drop this component on the canvas.
Then add input data for the x, y, and z parameters
using Number Slider parameters.
Find the Number Slider parameters
in the Input panel of the Params tab.
Or double click on the canvas to search for a component
and then type in either number slider or a value for the slider such as 10.
Connect wires from each of the output nodes
on the right side of the number sliders
to the respective input node on the left of the Construct Point component.
Drag the handle on each slider to a set x, y, and z values for the point.
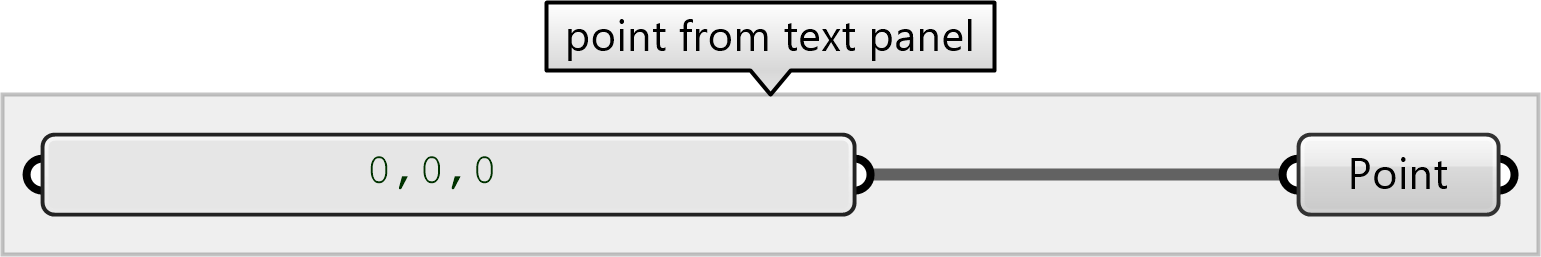
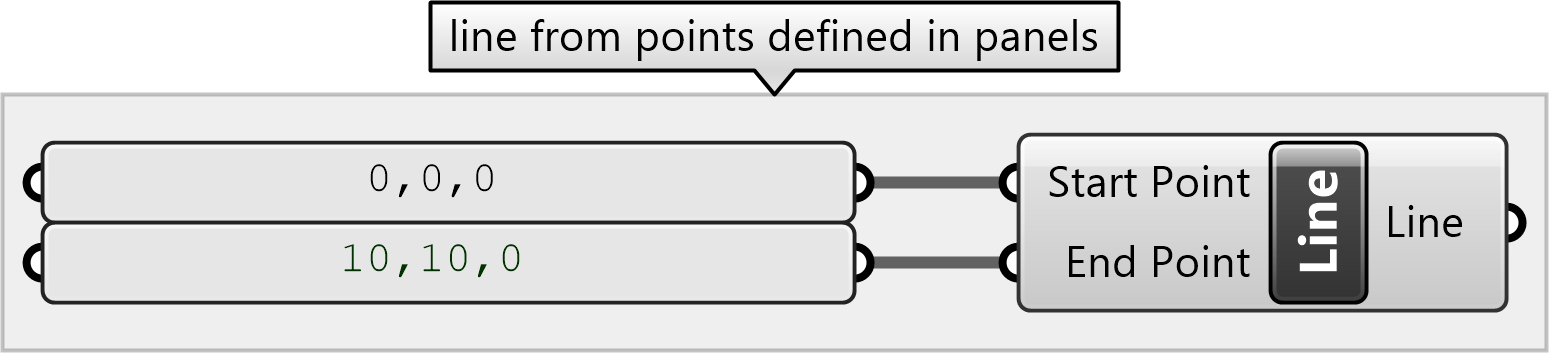
Points can also be defined by text panels with x, y, and z values.
Place a Point parameter
from the Input panel of the Params tab on the canvas.
Then place a Panel parameter from Input panel.
Double click on the panel to edit it.
Type in x, y, and z values separated by commas.
Connect the Panel to the Point parameter.
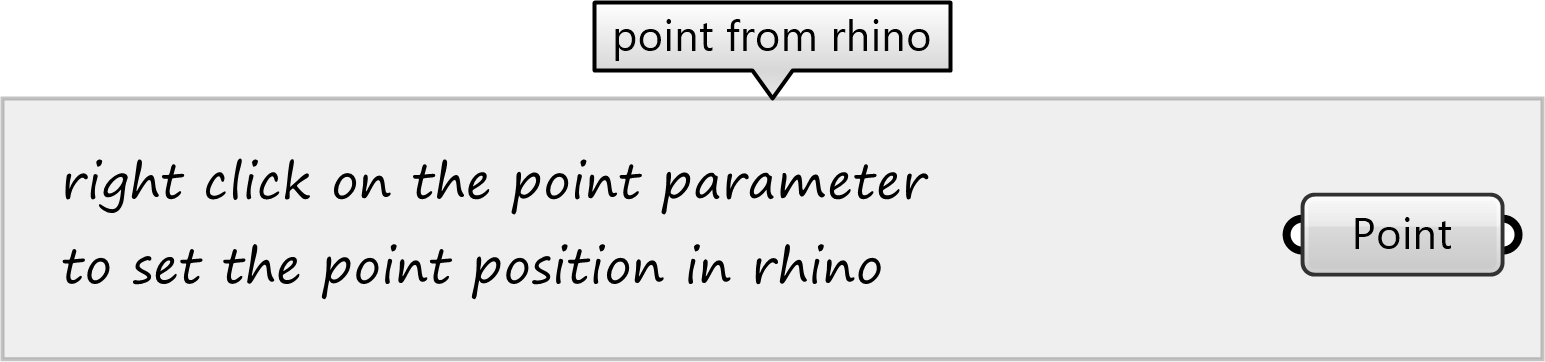
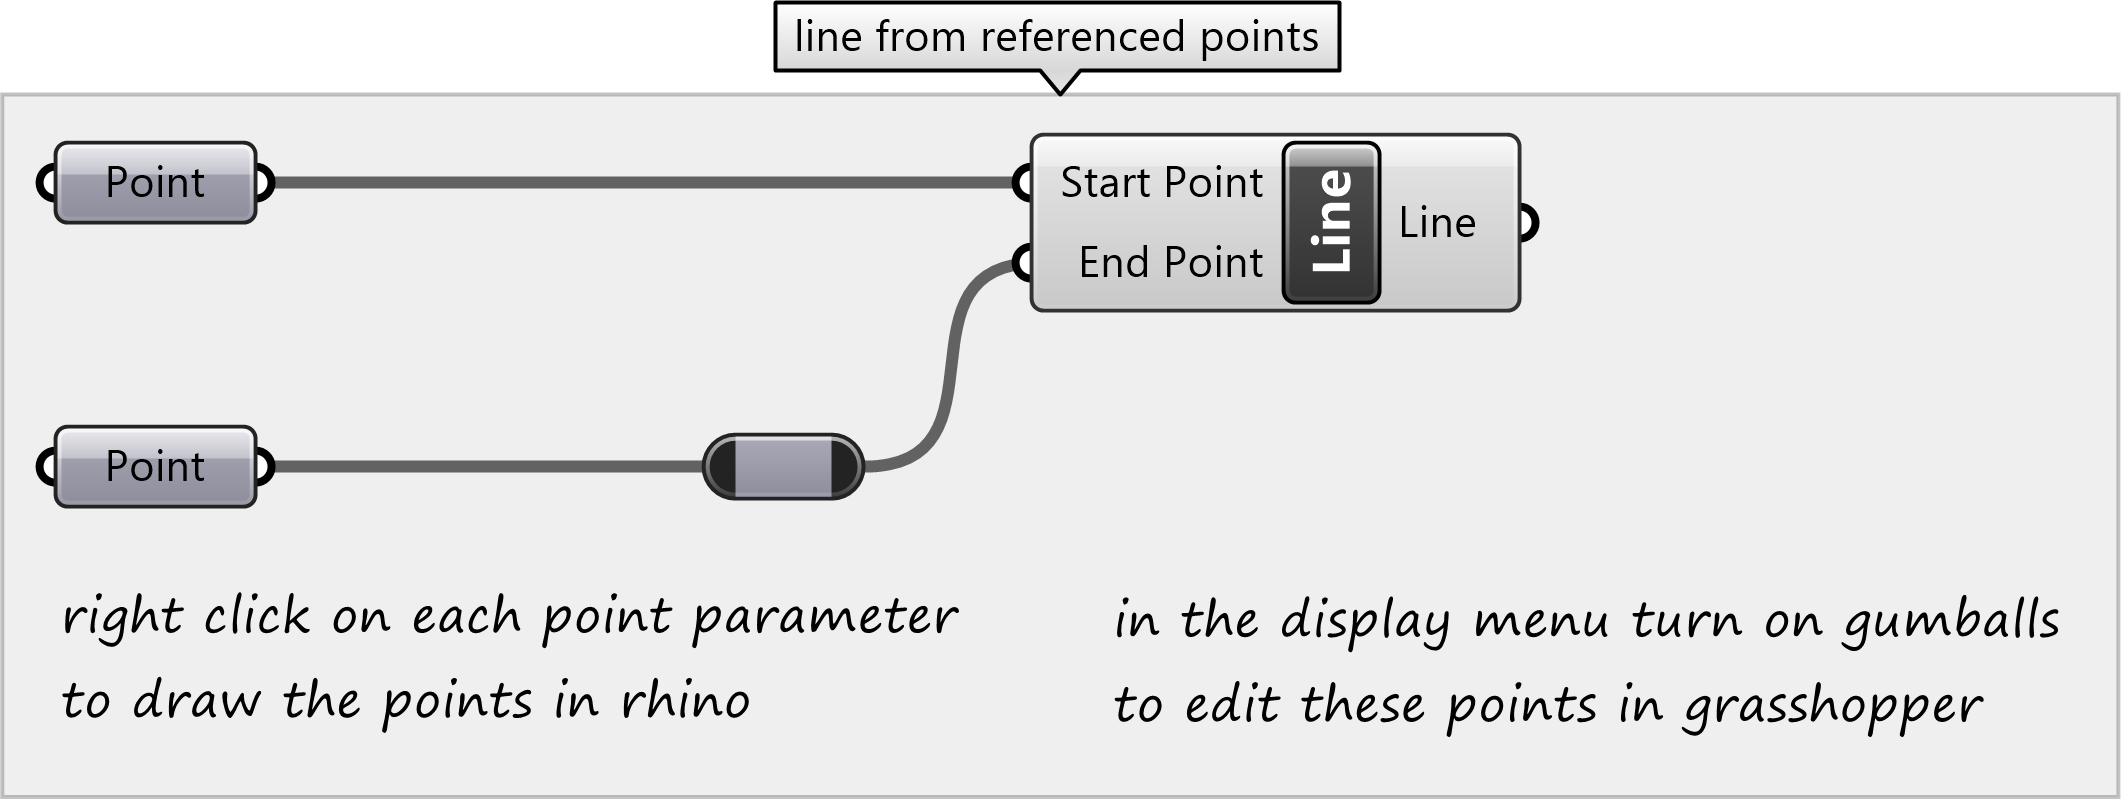
The Point parameter can also be set
to a point drawn in Rhino.
Right click on the Point parameter
and select set one point.
Grasshopper will minimize
and the command line in Rhino will ask for a point location.
Either draw a point in one of the Rhino viewports
or type x, y, and z values separated by commas into the command line.
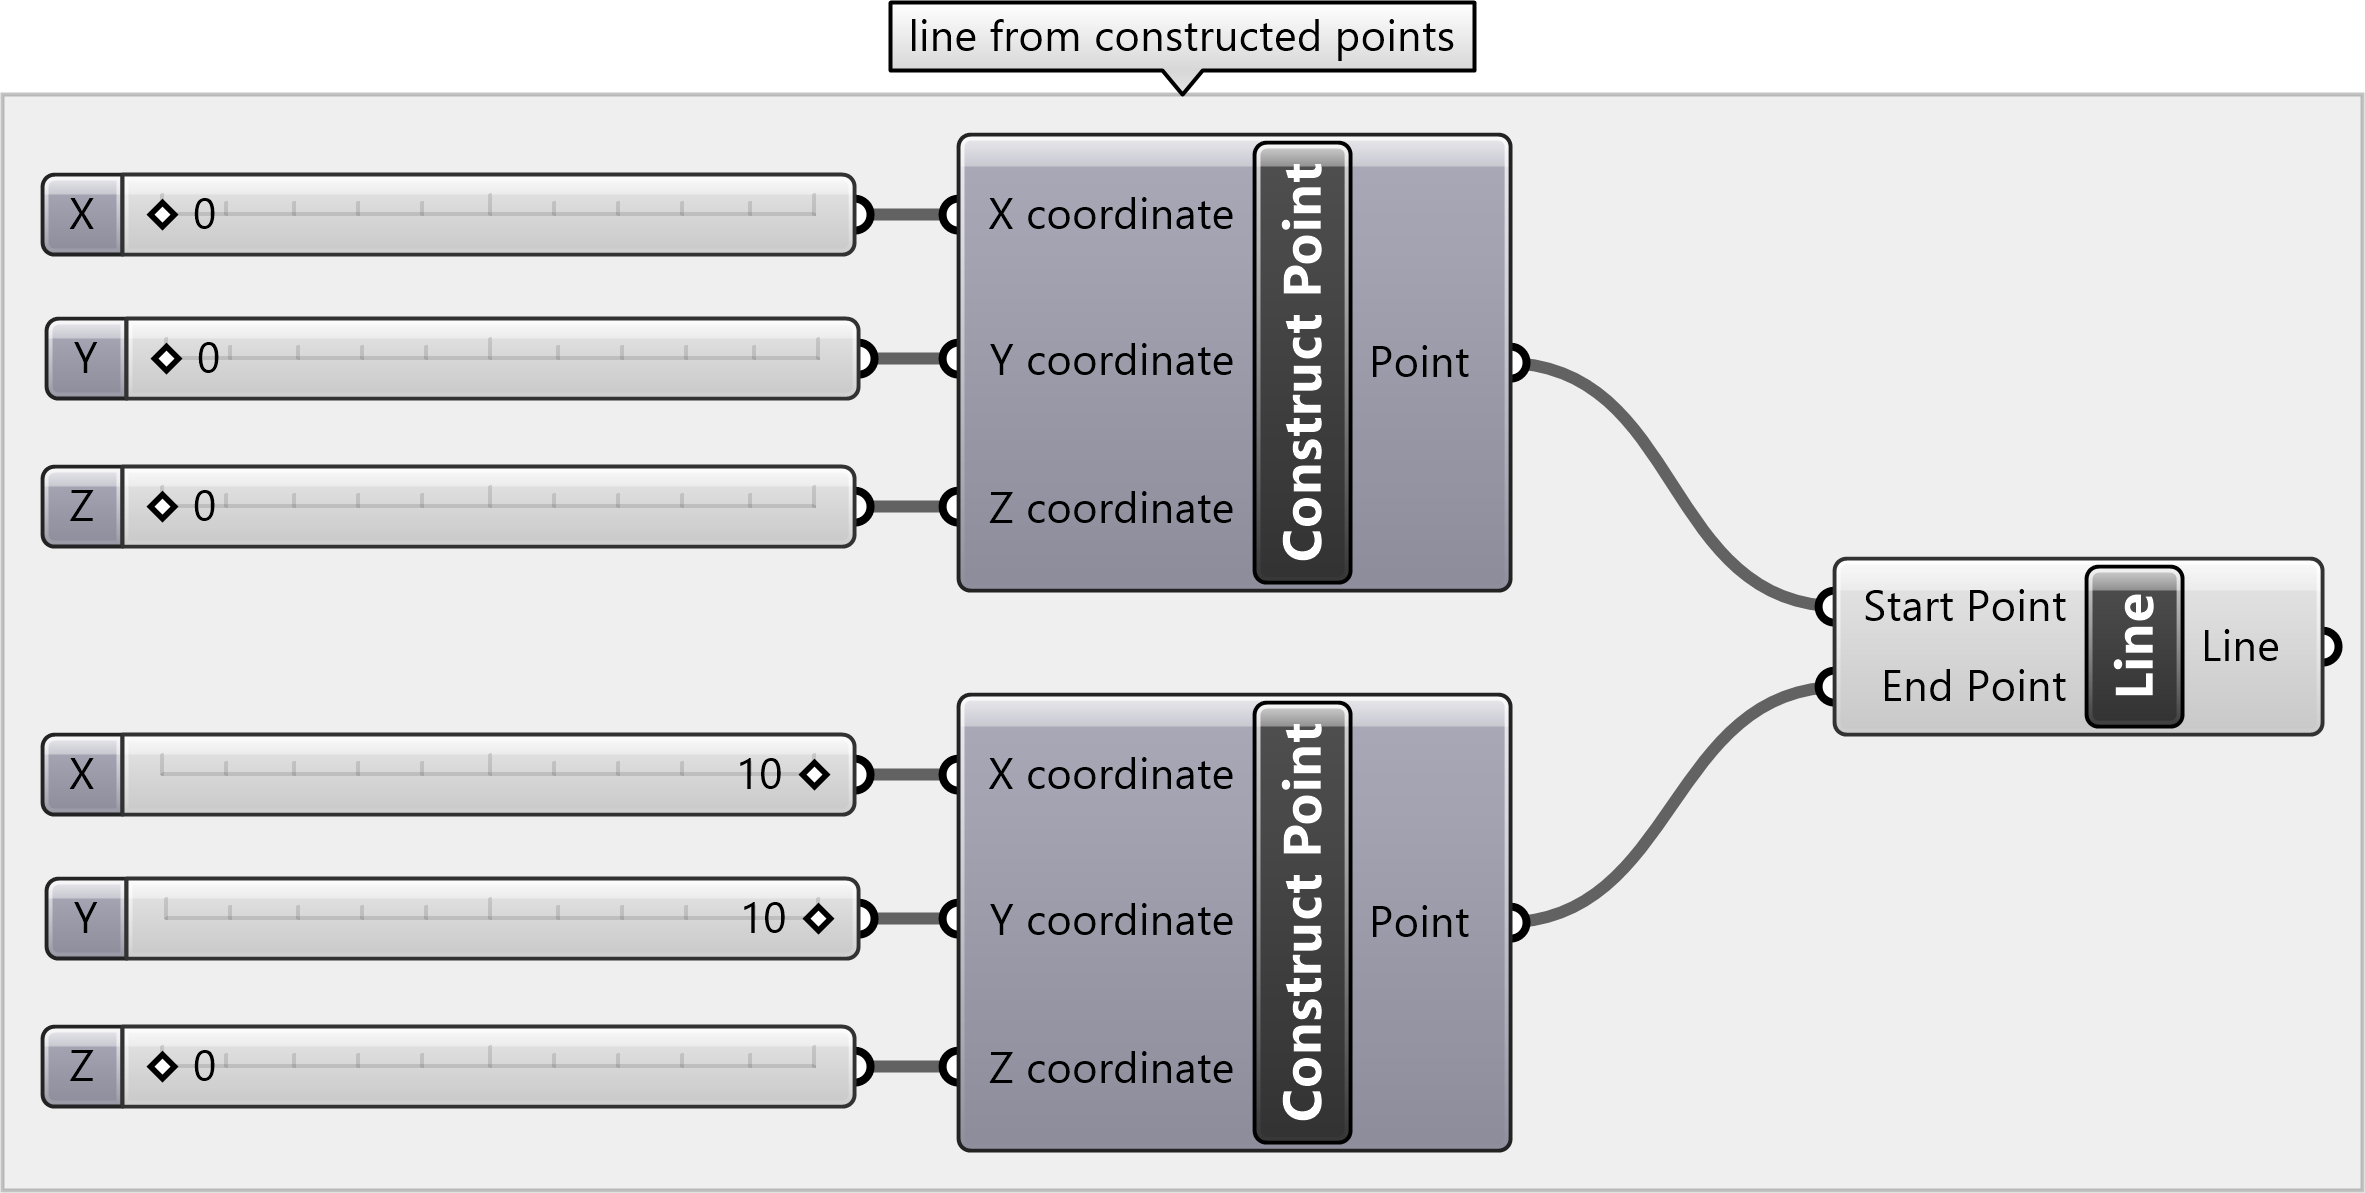
Lines
In Grasshopper,
lines can be defined by start and end points
by a start point, direction, and length,
or by drawing a line in Rhino.
Start and end points can set by
constructing points from sliders,
by defining coordinate in panels,
or by drawing points in Rhino.
Place a
Line
component from the Input panel of the Params tab on the canvas.
Then connect the output for start and end points -
whether from Number Slider, Point, or Panel parameters -
to the respective input parameters on the Line component.
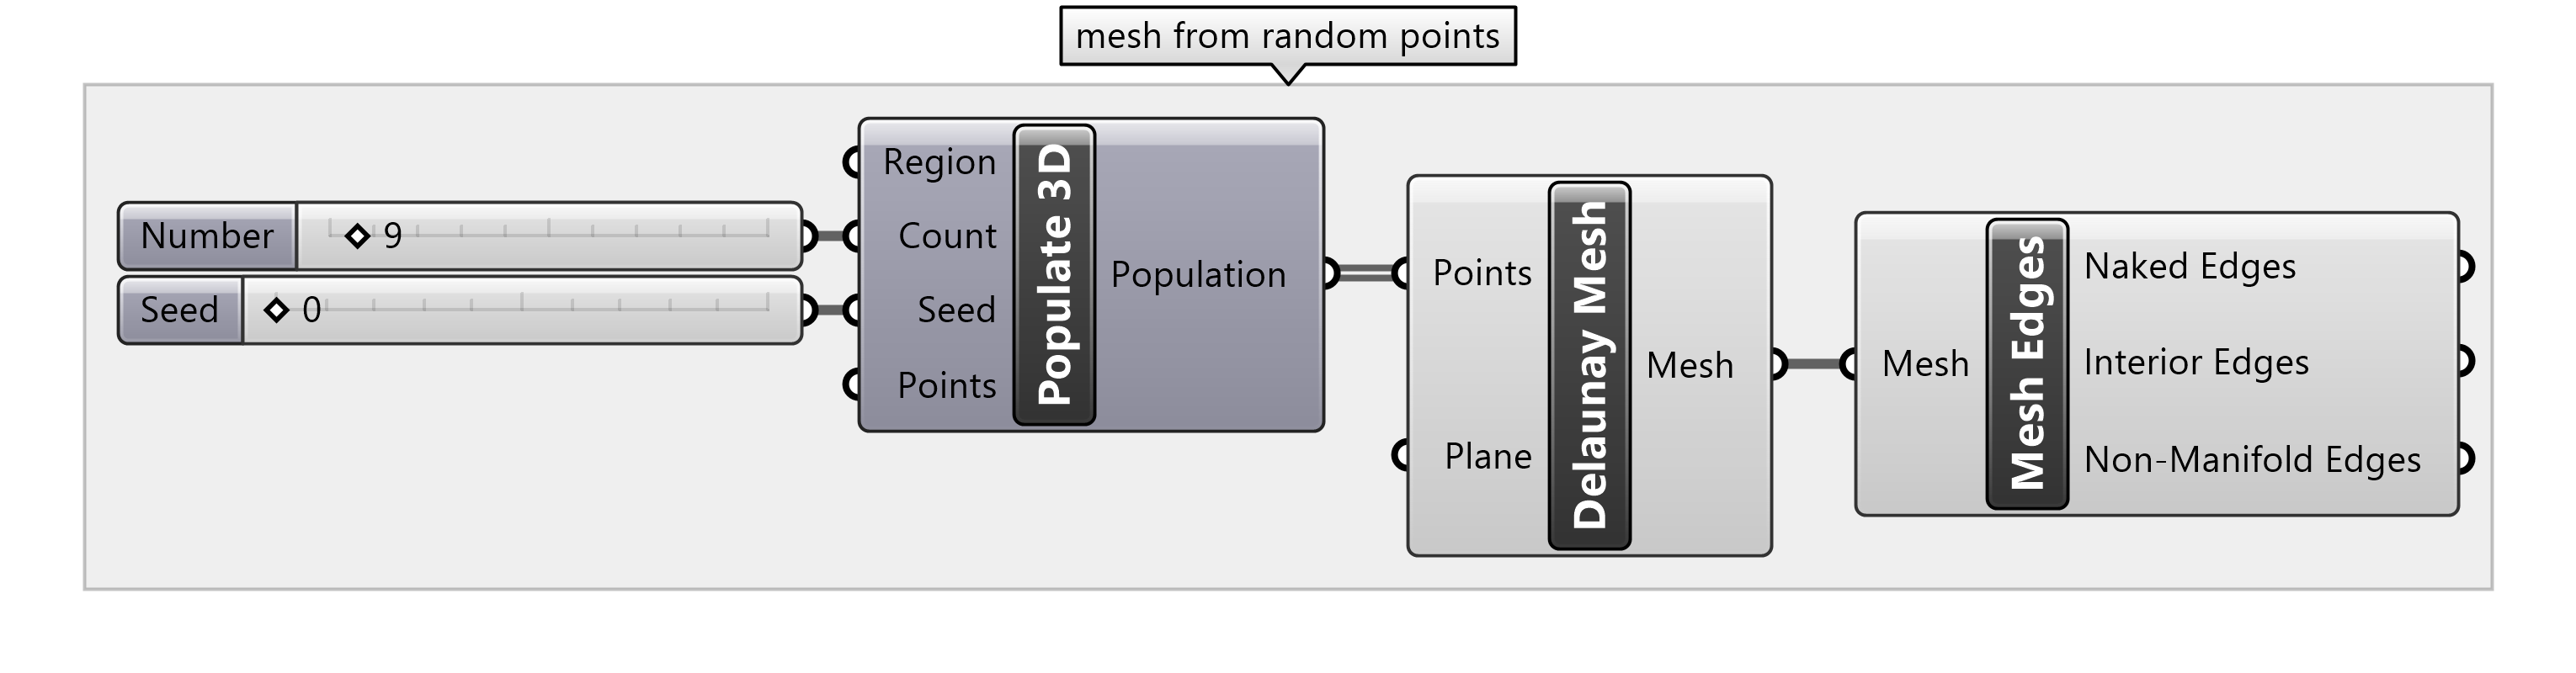
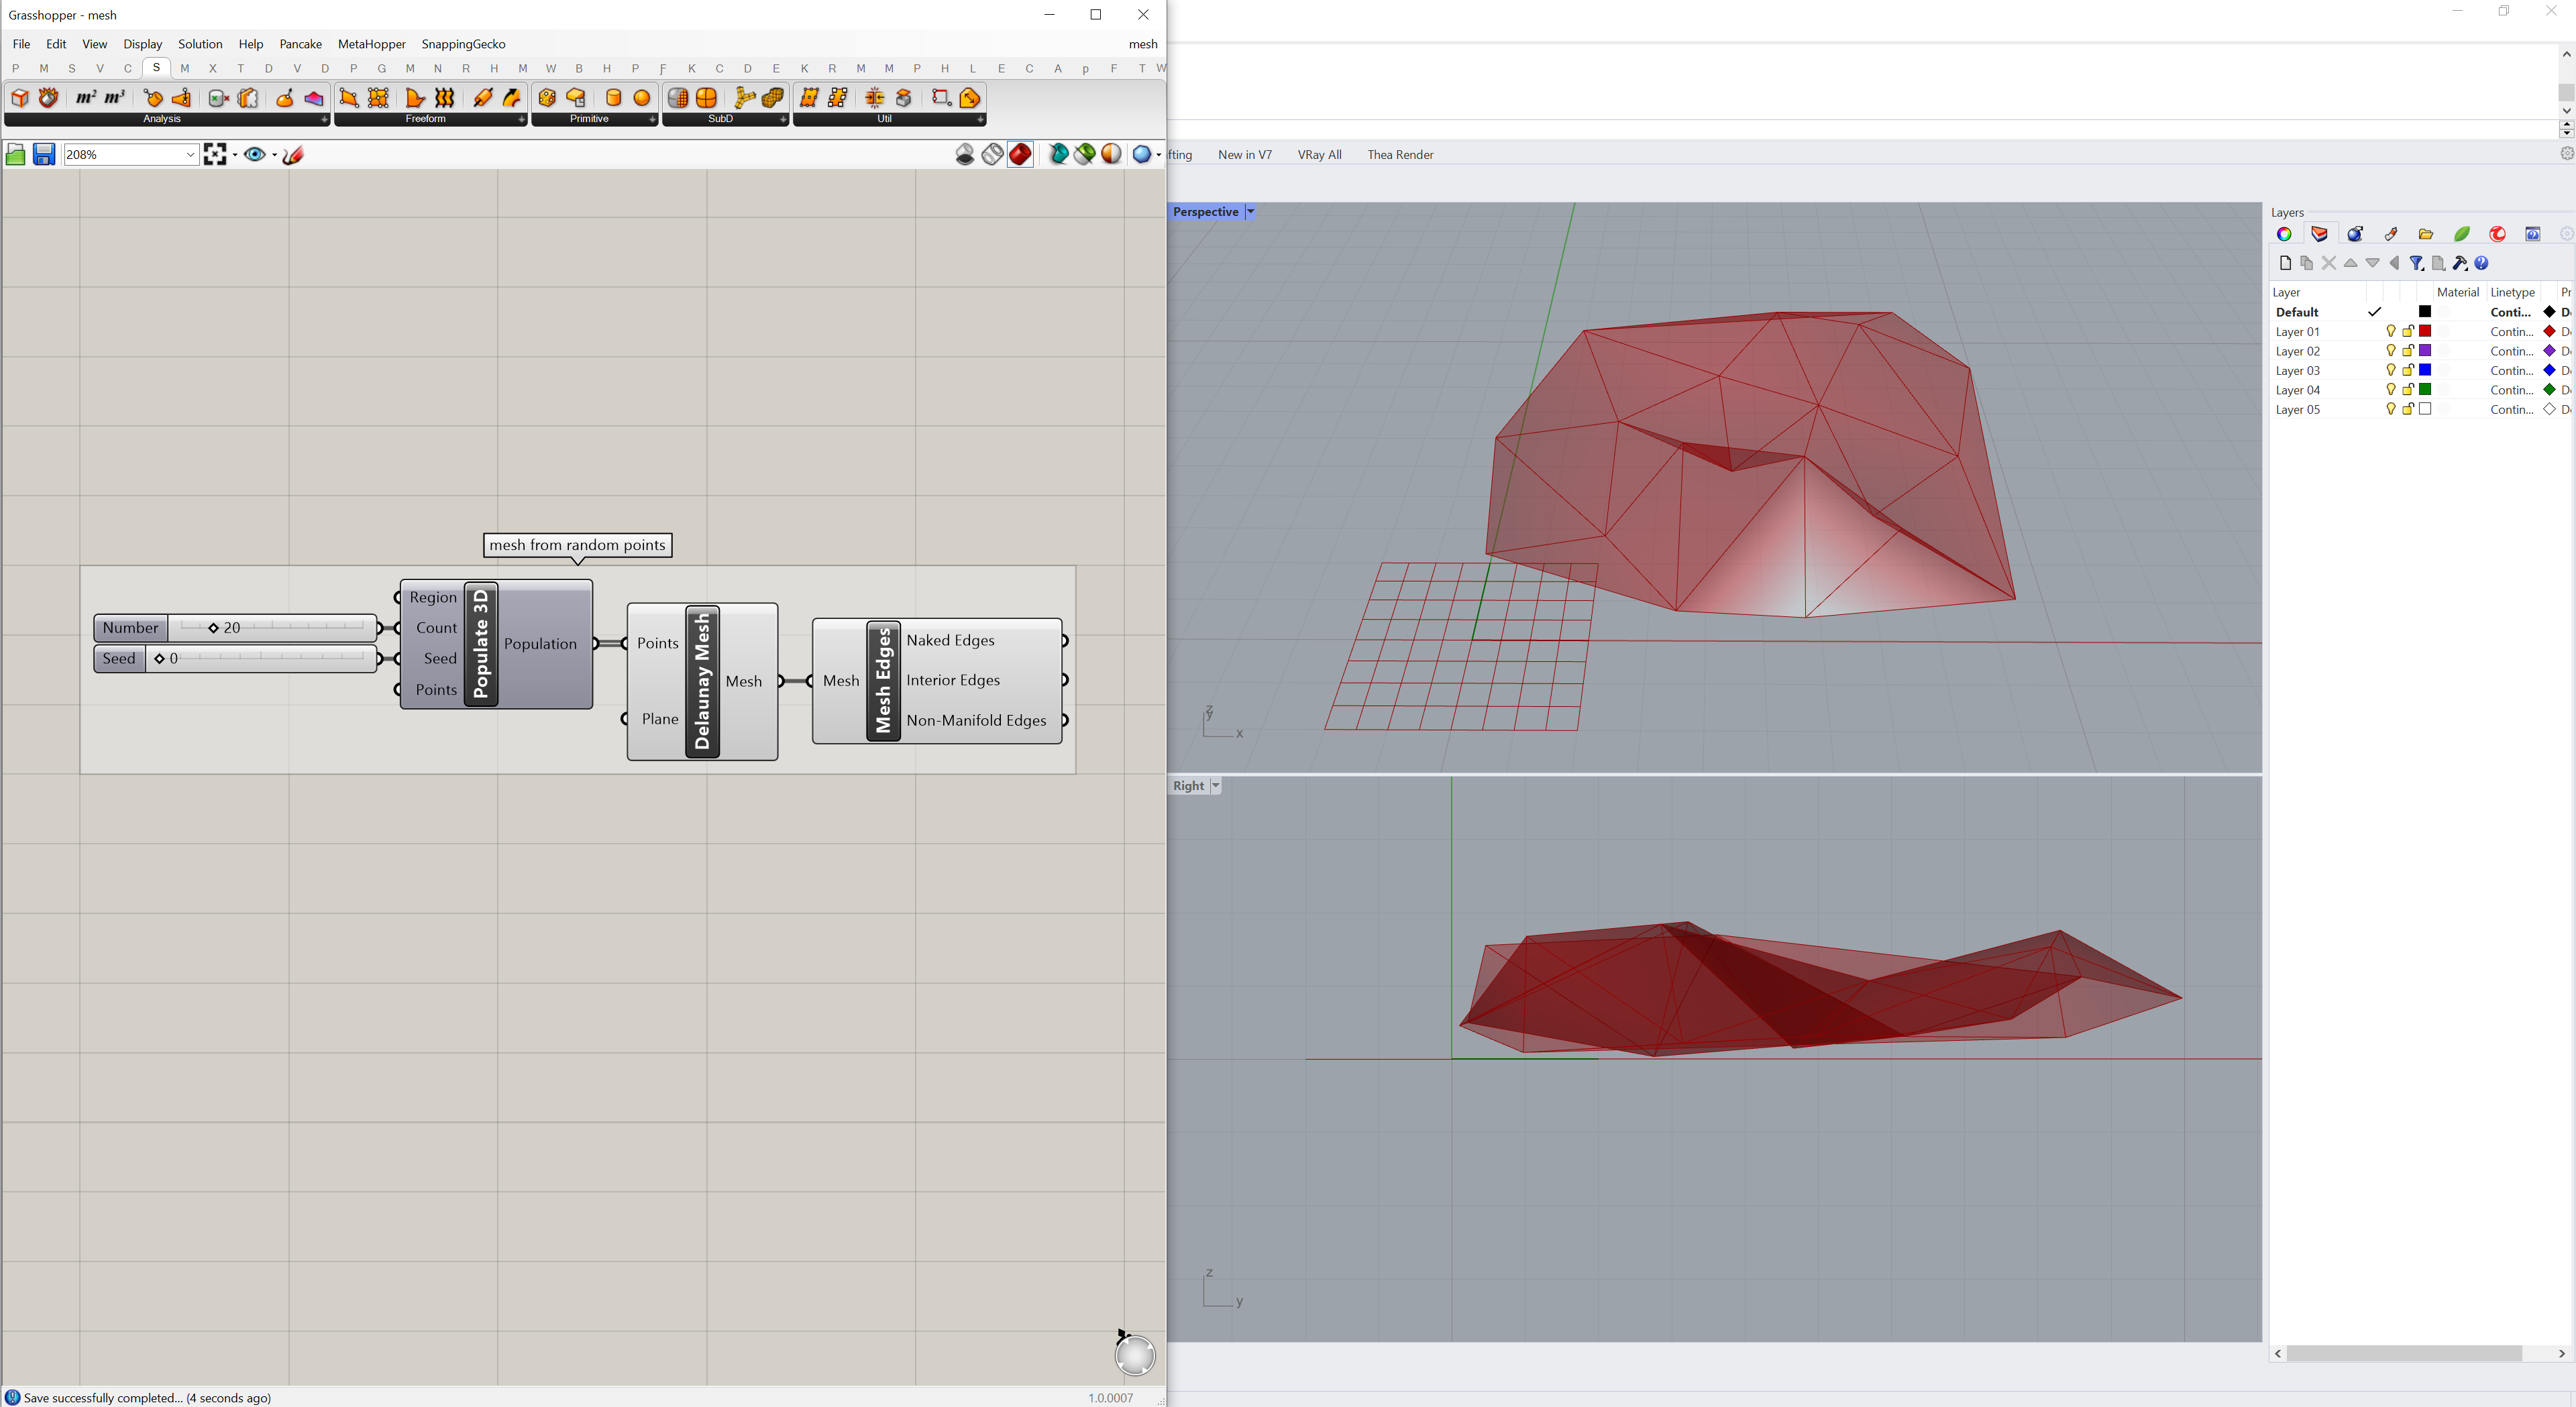
Meshes
A mesh is a set of connected polygons composed of vertices, edges, and faces. Meshes are often used to represent topography. In Grasshopper, a mesh can be generated from a set of points using the Delaunay triangulation algorithm.
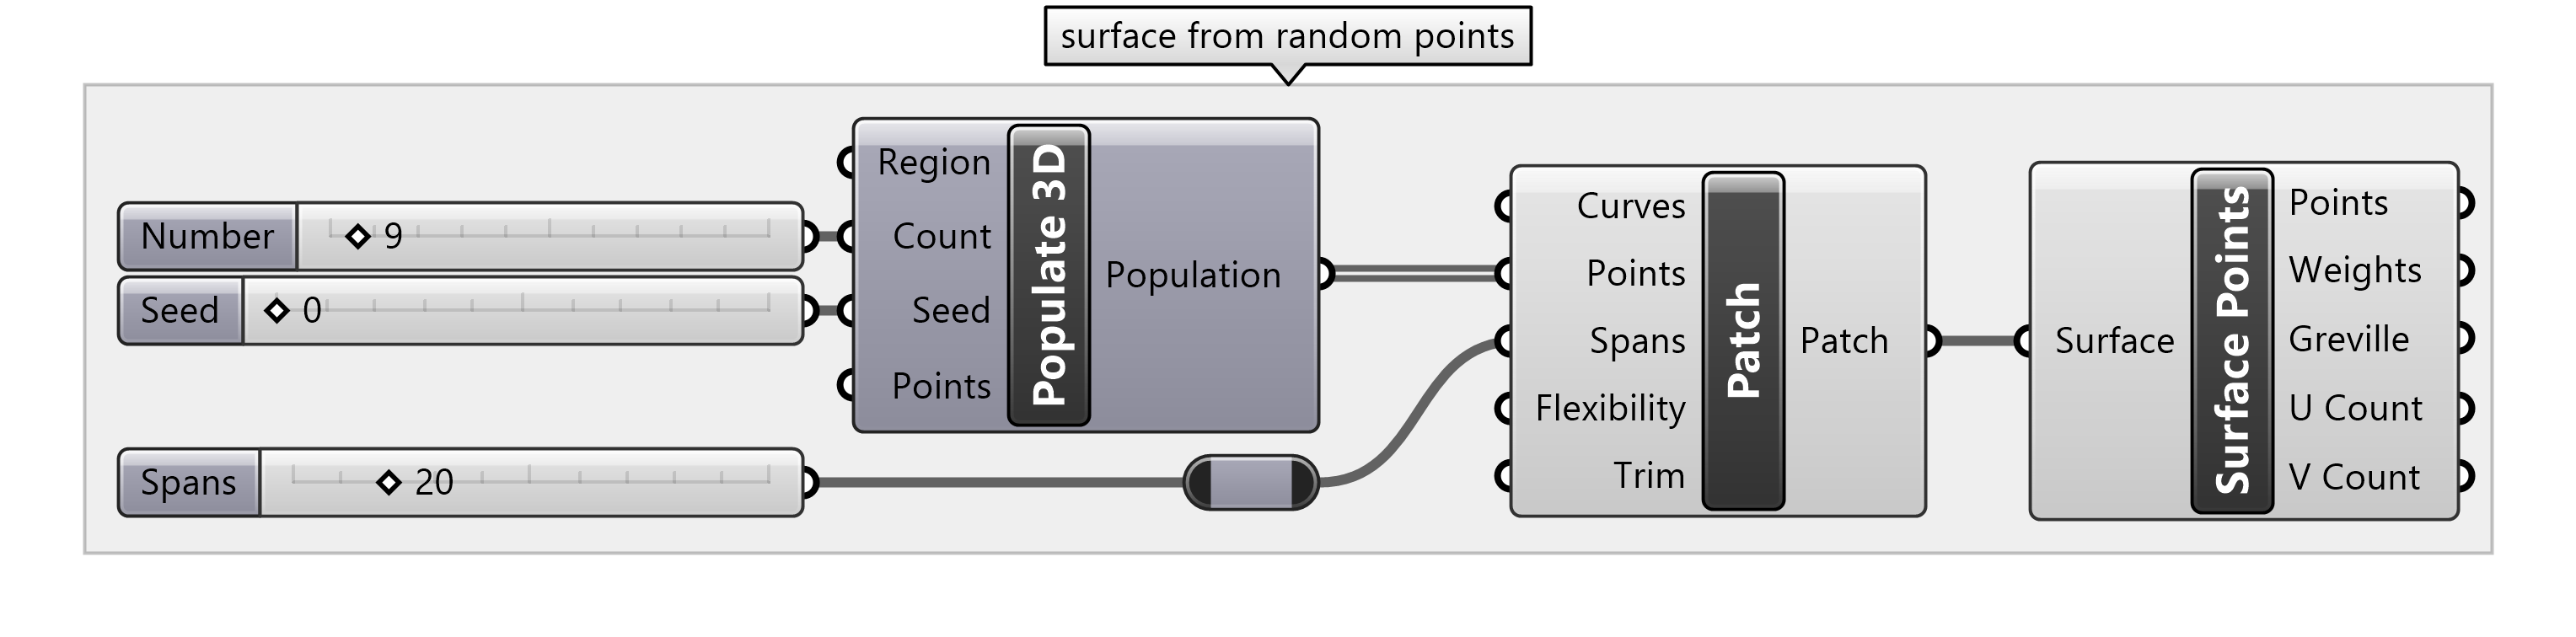
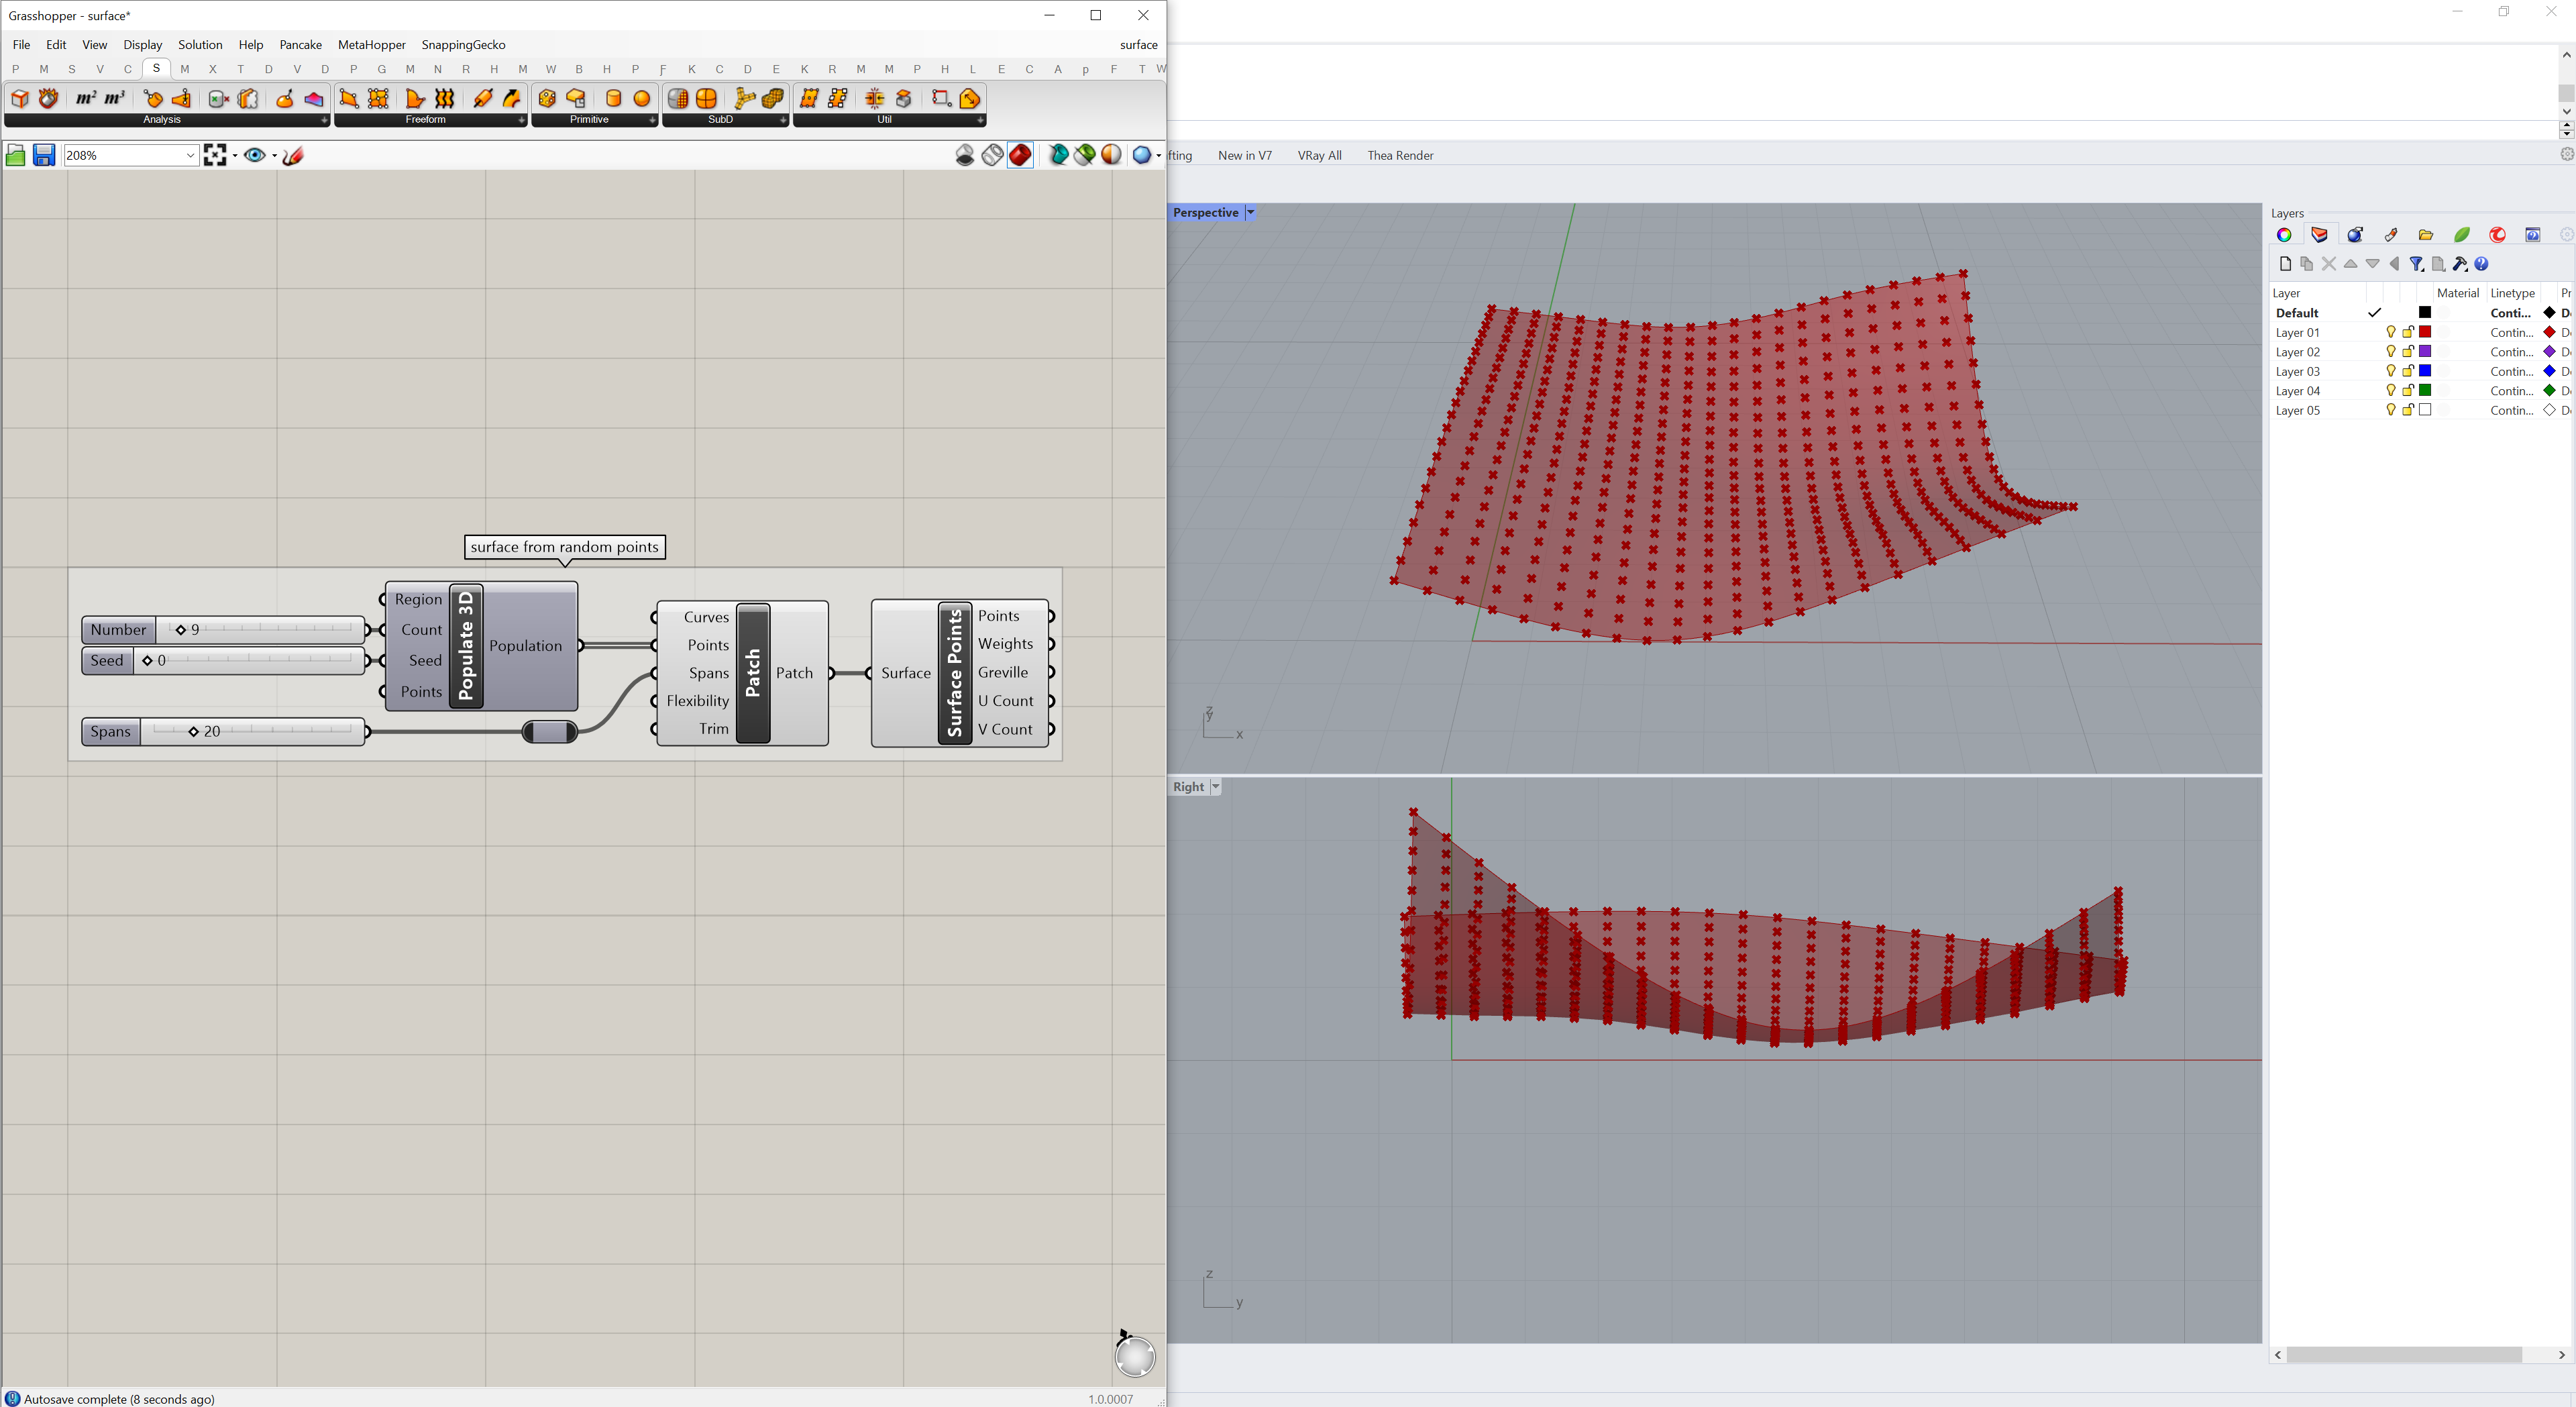
Surfaces
Topography can also be represented as smooth, continuous surfaces defined by boundaries, control points, and surface tension.
Terrain Modeling
This part of the tutorial covers terrain modeling with the Docofossor plugin. Download the example definition topographic-modeling.gh as a guide for this section.
Data
Docofossor, is a Grasshopper plugin for efficiently and iteratively modeling terrain using signed distance functions. In Docofossor terrain is represented as a grid of elevation values (Z). Docofossor’s signed distance field (df) data structure has a header that defines the properties of the grid and then a list of Z values. This grid of values can be transformed using signed distance functions, enabling an efficient, iterative process for terrain modeling in Grasshopper. To visualize the terrain data in Grasshopper the grid can be converted into either 3D points or a quadrilateral mesh. To install this plugin on Windows first download Docofossor, right click on the zip archive to open properties and unblock it, then extract the zip archive, move the contents to your Grasshopper components library, and restart Rhino and Grasshopper.
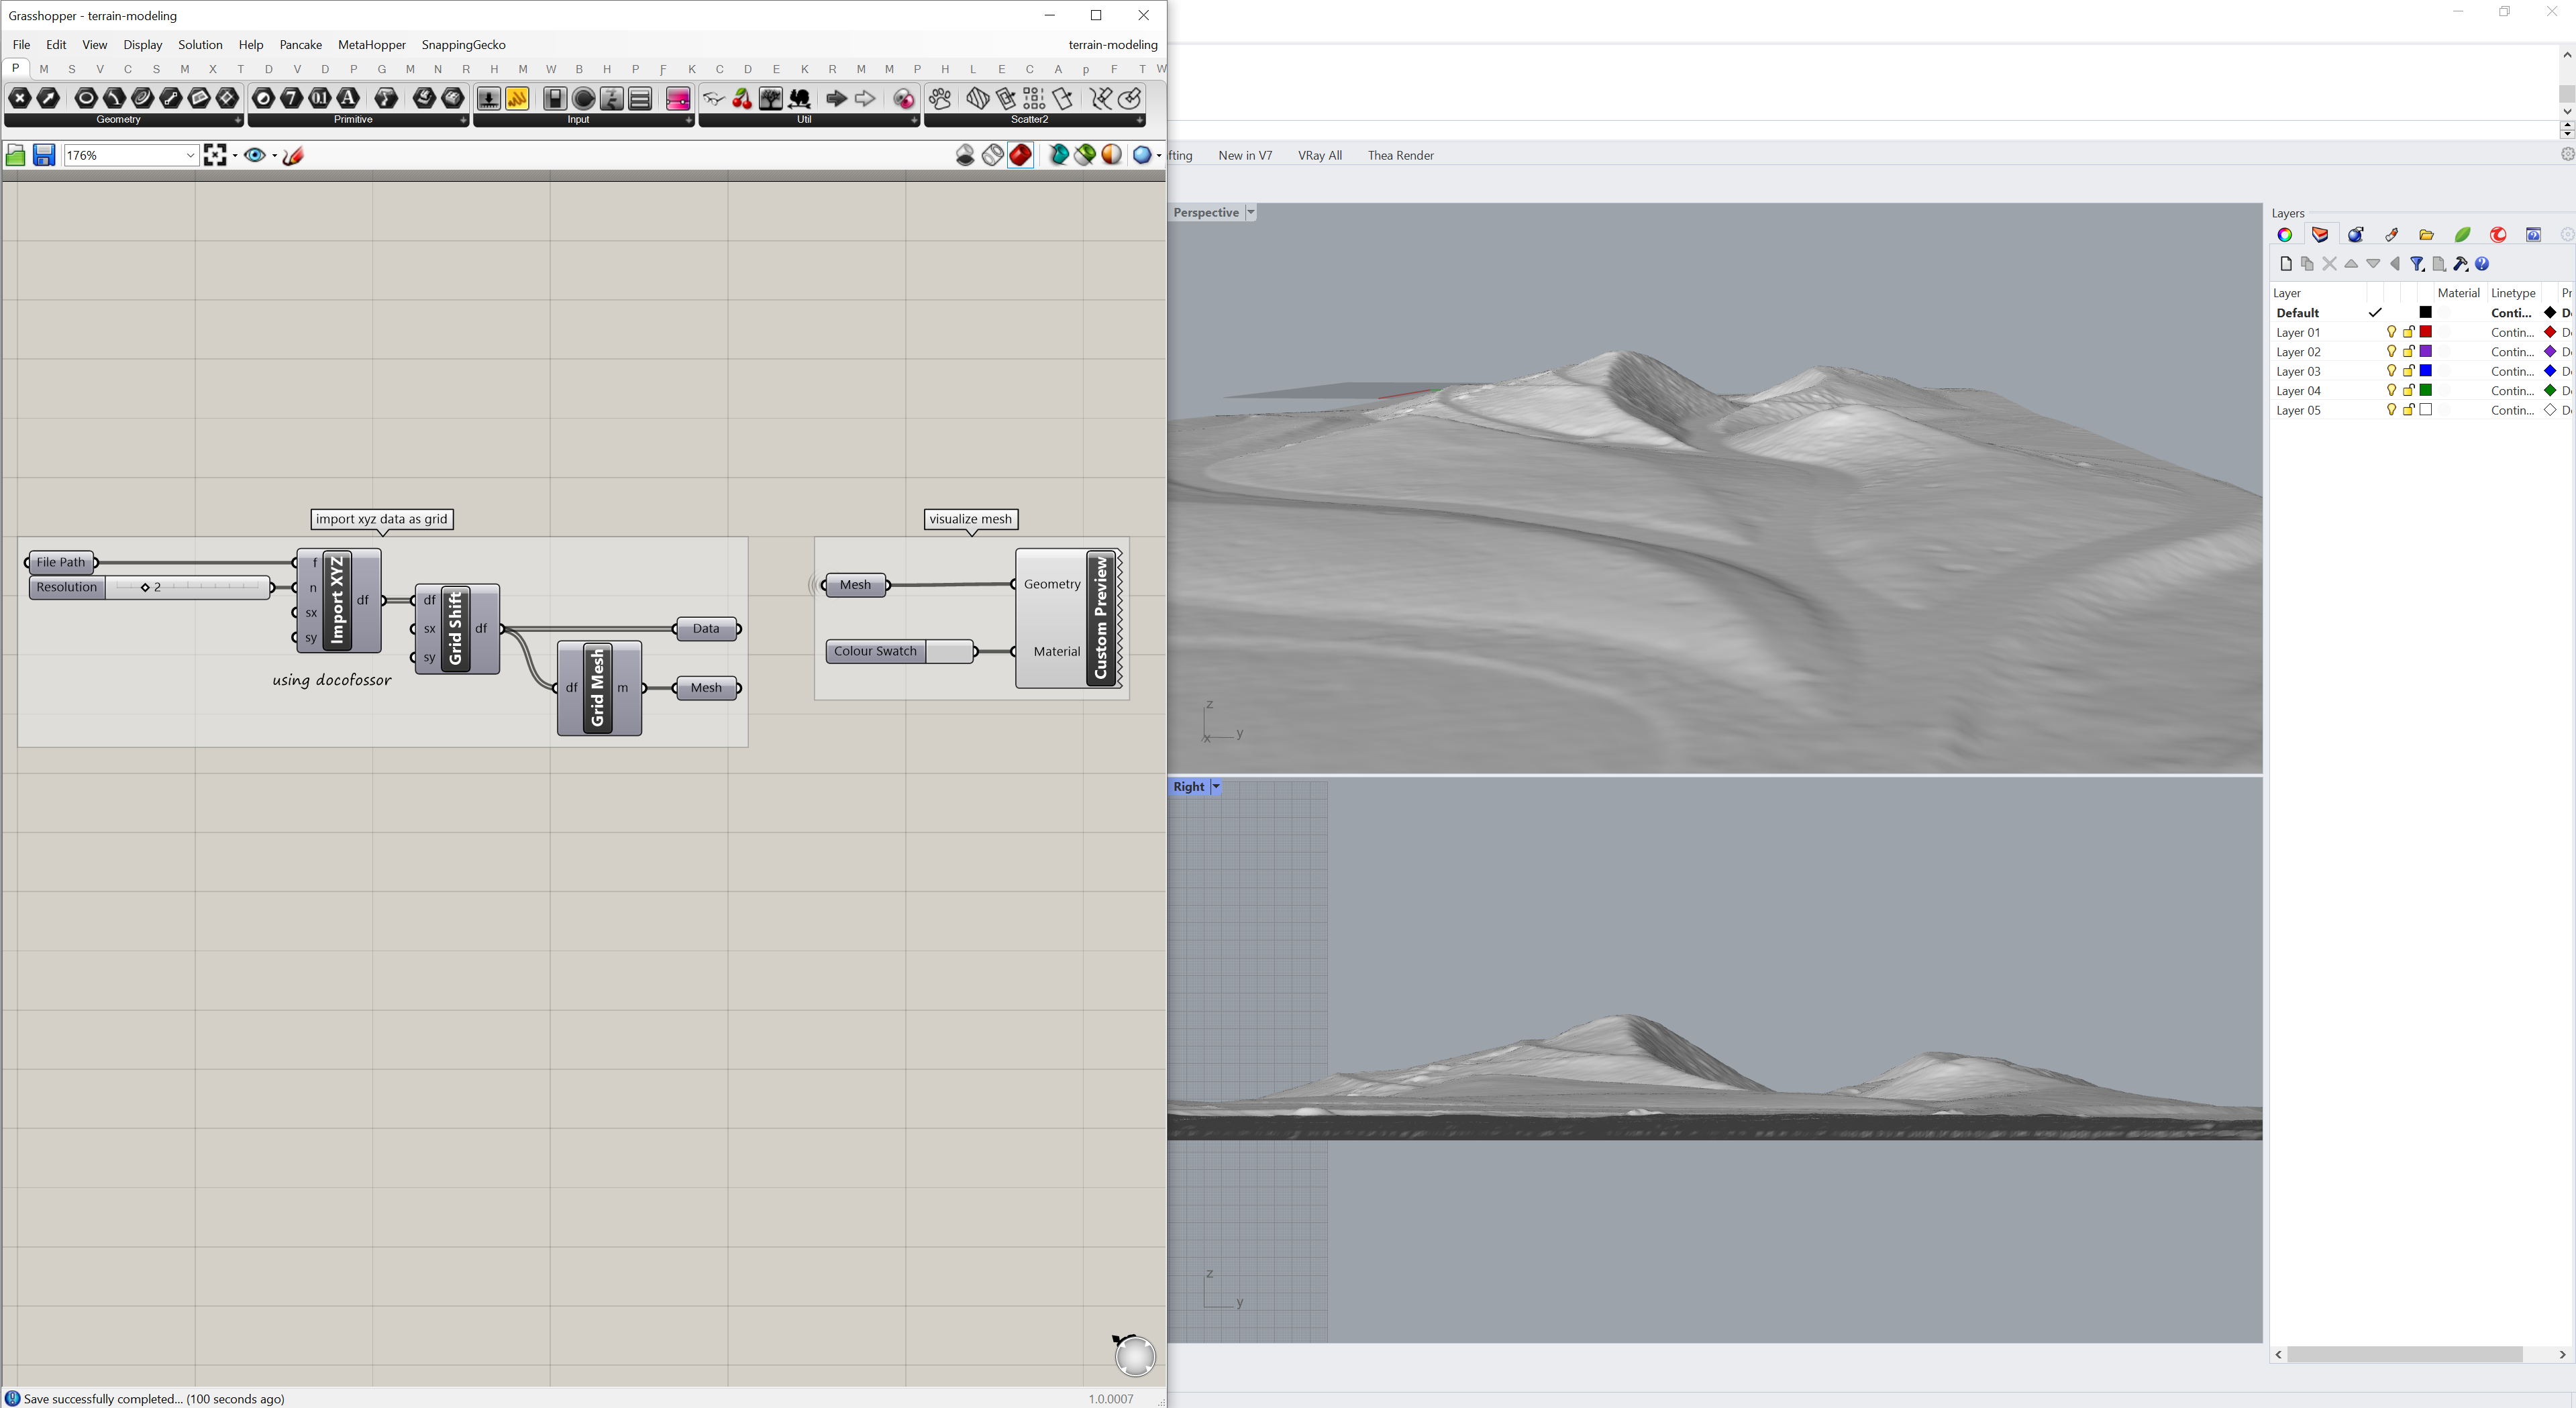
Modeling
Download the gridded point cloud
governors-island-landform.xyz
for the Hills of Governor’s Island.
In Grasshopper add the file path for this dataset
to your canvas as a parameter.
In the Params tab under Primitive select and add a File Path parameter.
Right click on the parameter, choose select an existing file,
and set the path to the downloaded .xyz data.
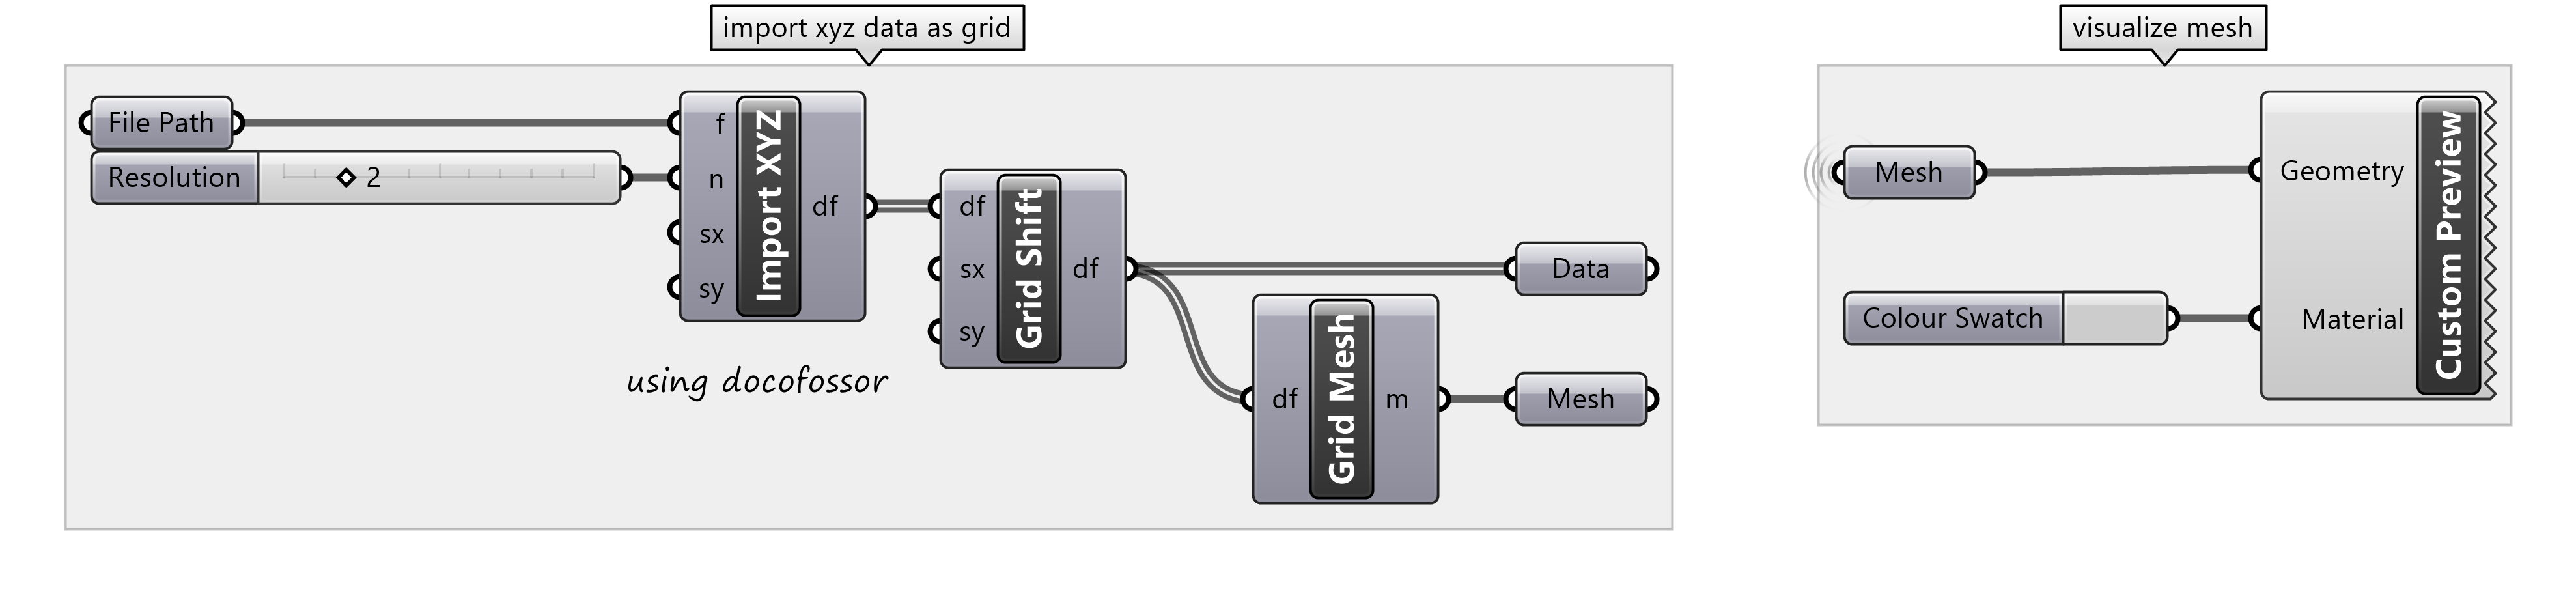
In the Docofossor tab under IO add the
dfImportXYZ
component.
Set dfImportXYZ’s
input parameter f to the File Path parameter
to import the point cloud as a Docofossor grid (df).
Optionally add a skip parameter n to reduce the size of the point cloud.
In the Docofossor tab under Grid add the
dfGridShift
component and set the grid as its input df
to shift the grid to from its geographic coordinates
to the XY origin of the local Cartesian coordinate system.
In the Docofossor tab under Geometry add the
dfGridMesh
component to generate a quadrilateral mesh from the shifted grid.
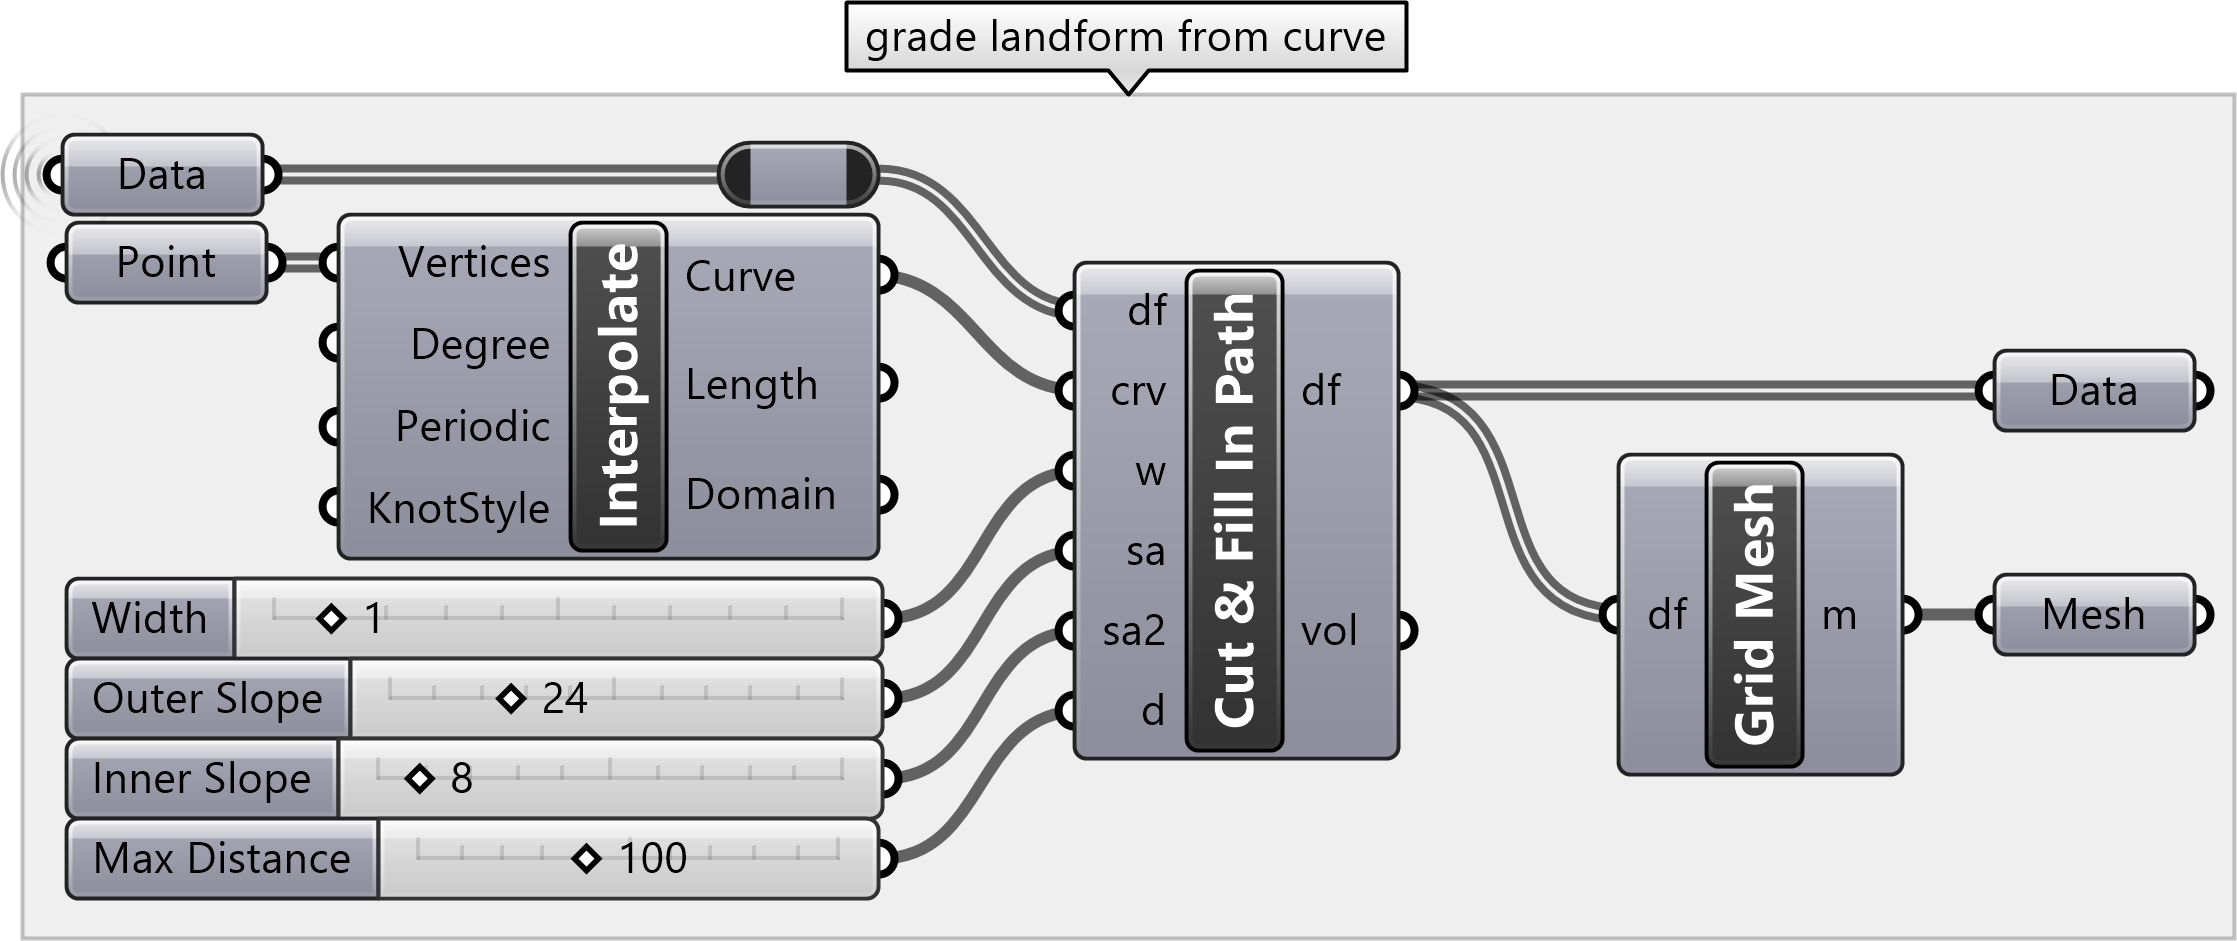
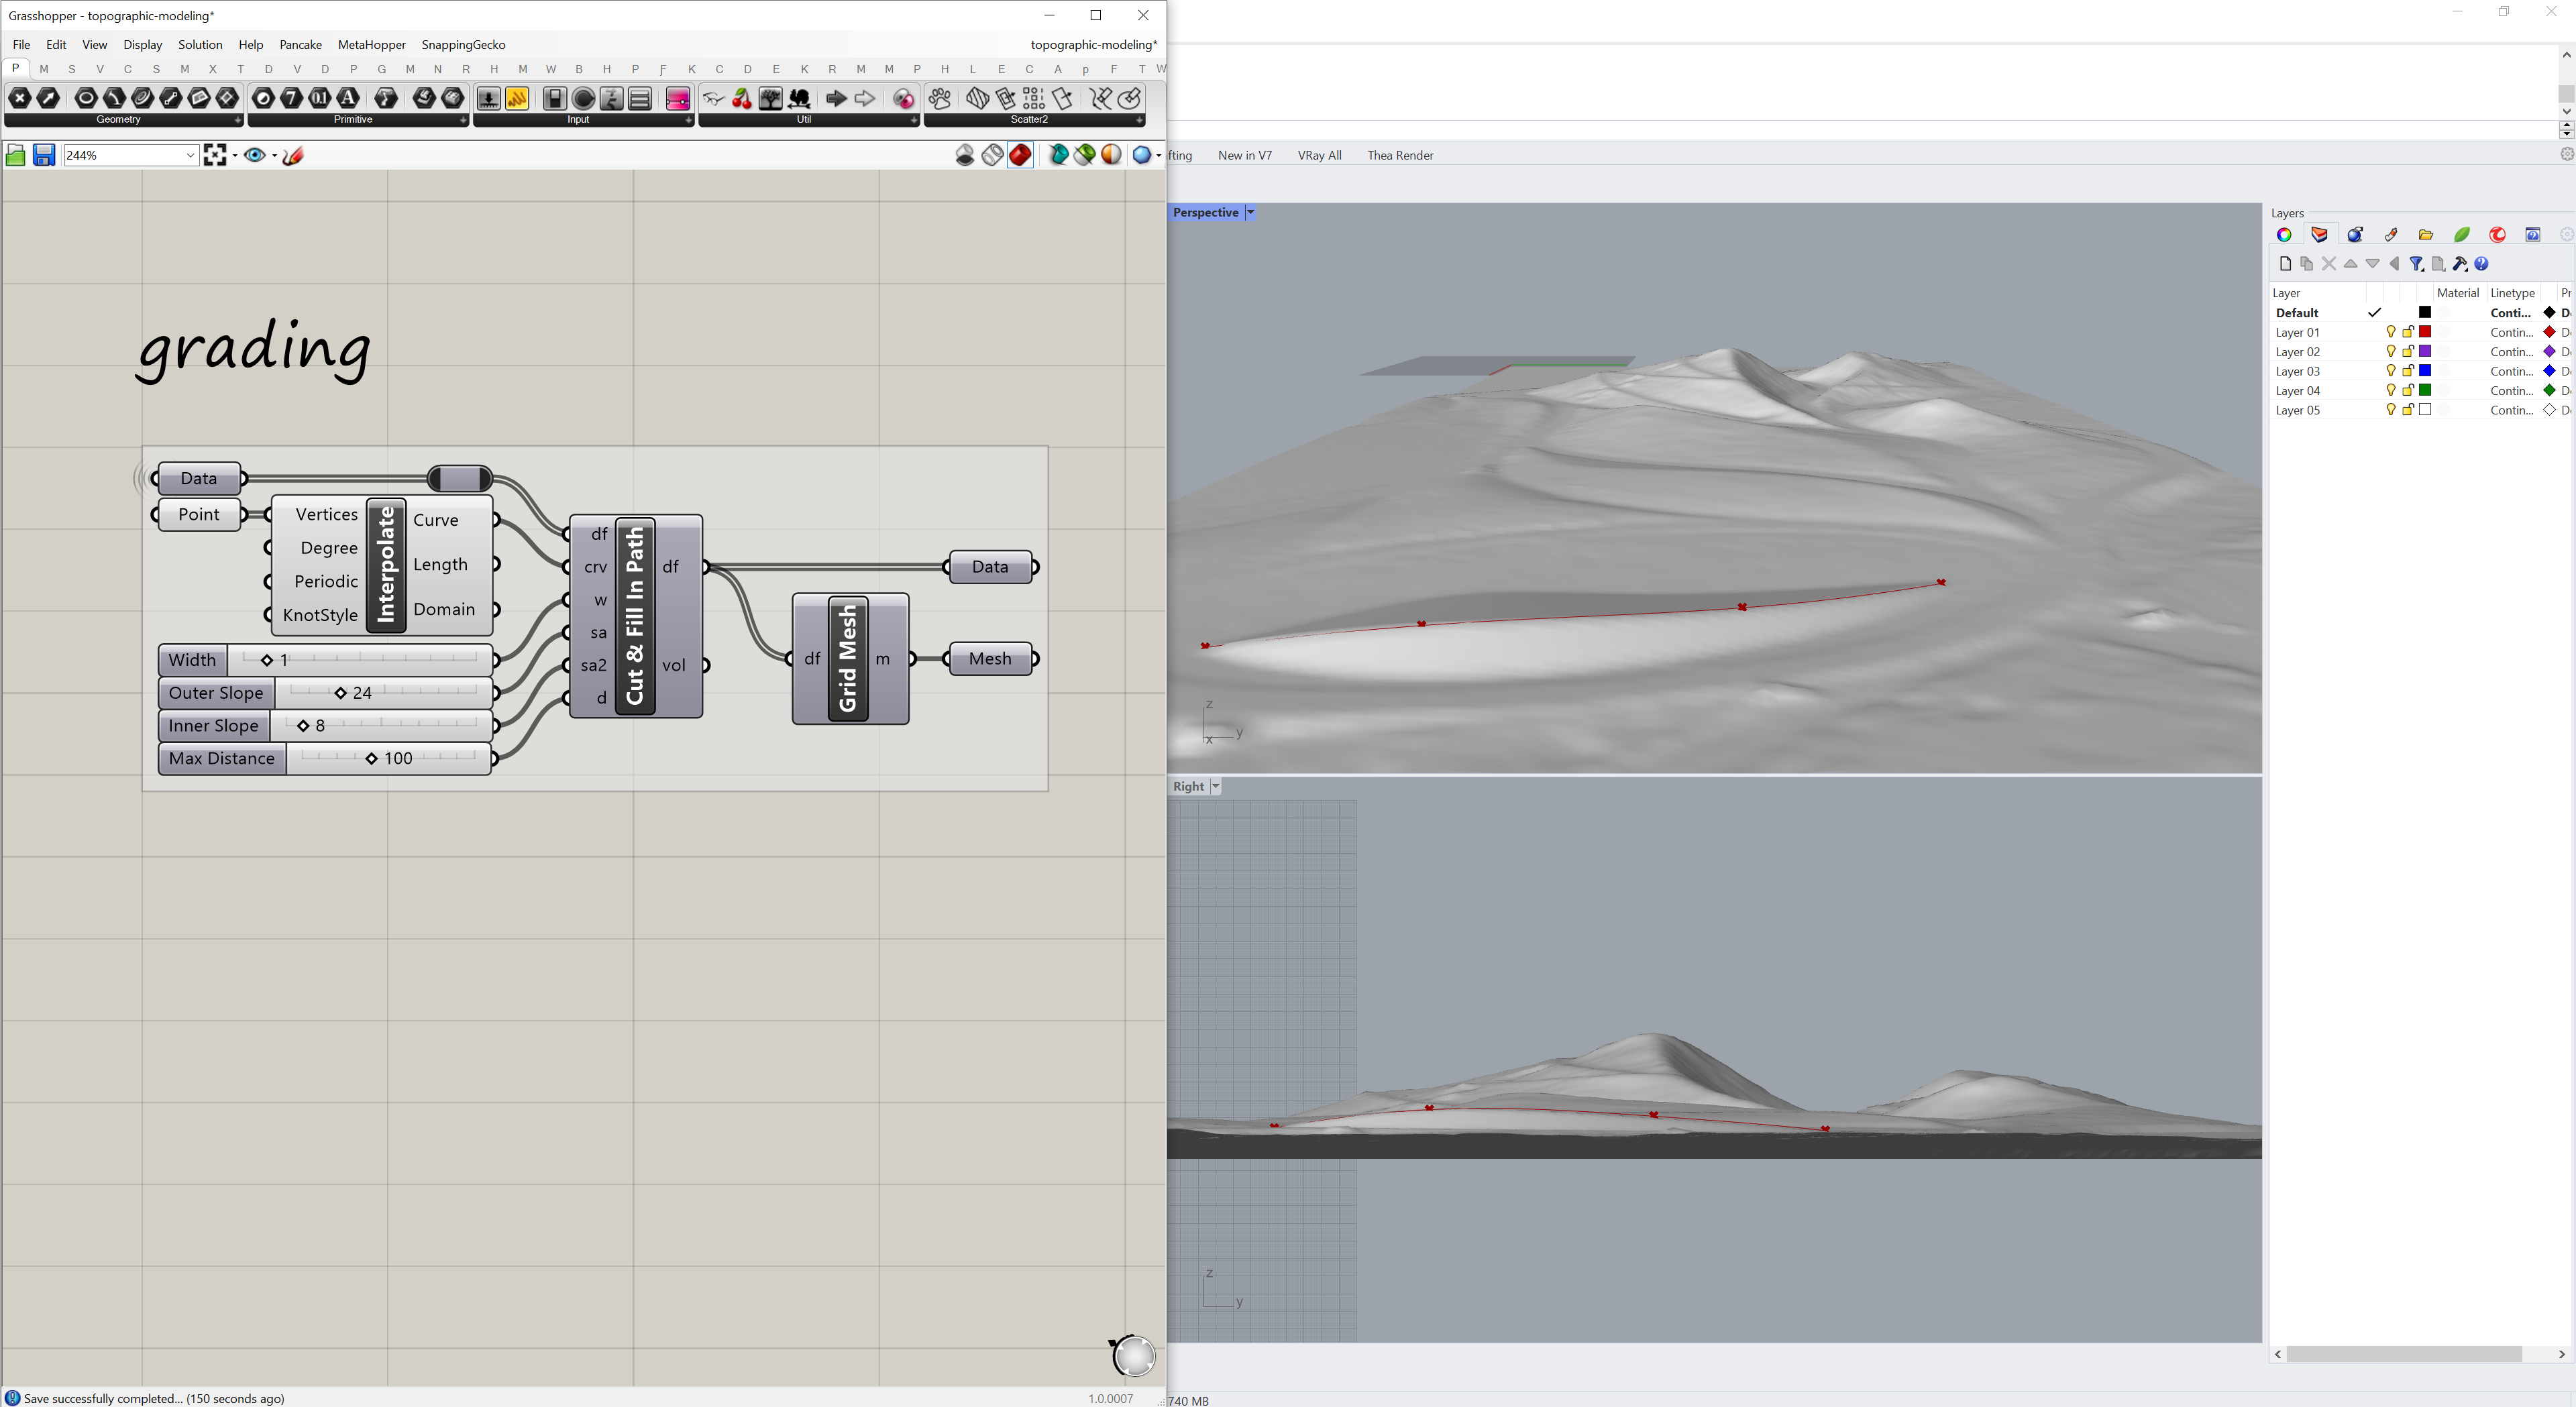
Grading
In the Docofossor tab under Operations Absolute add the
dfCutFillInPath
component to cut and fill along a curve.
Connect the terrain data as the input Docofossor list (df),
a curve interpolated through points as the input curve,
and number sliders for the
input width, inner slope, outer slope, and maximum distance.
Convert the output Docofossor list (df)
to a mesh for visualization with the
dfGridMesh
component.
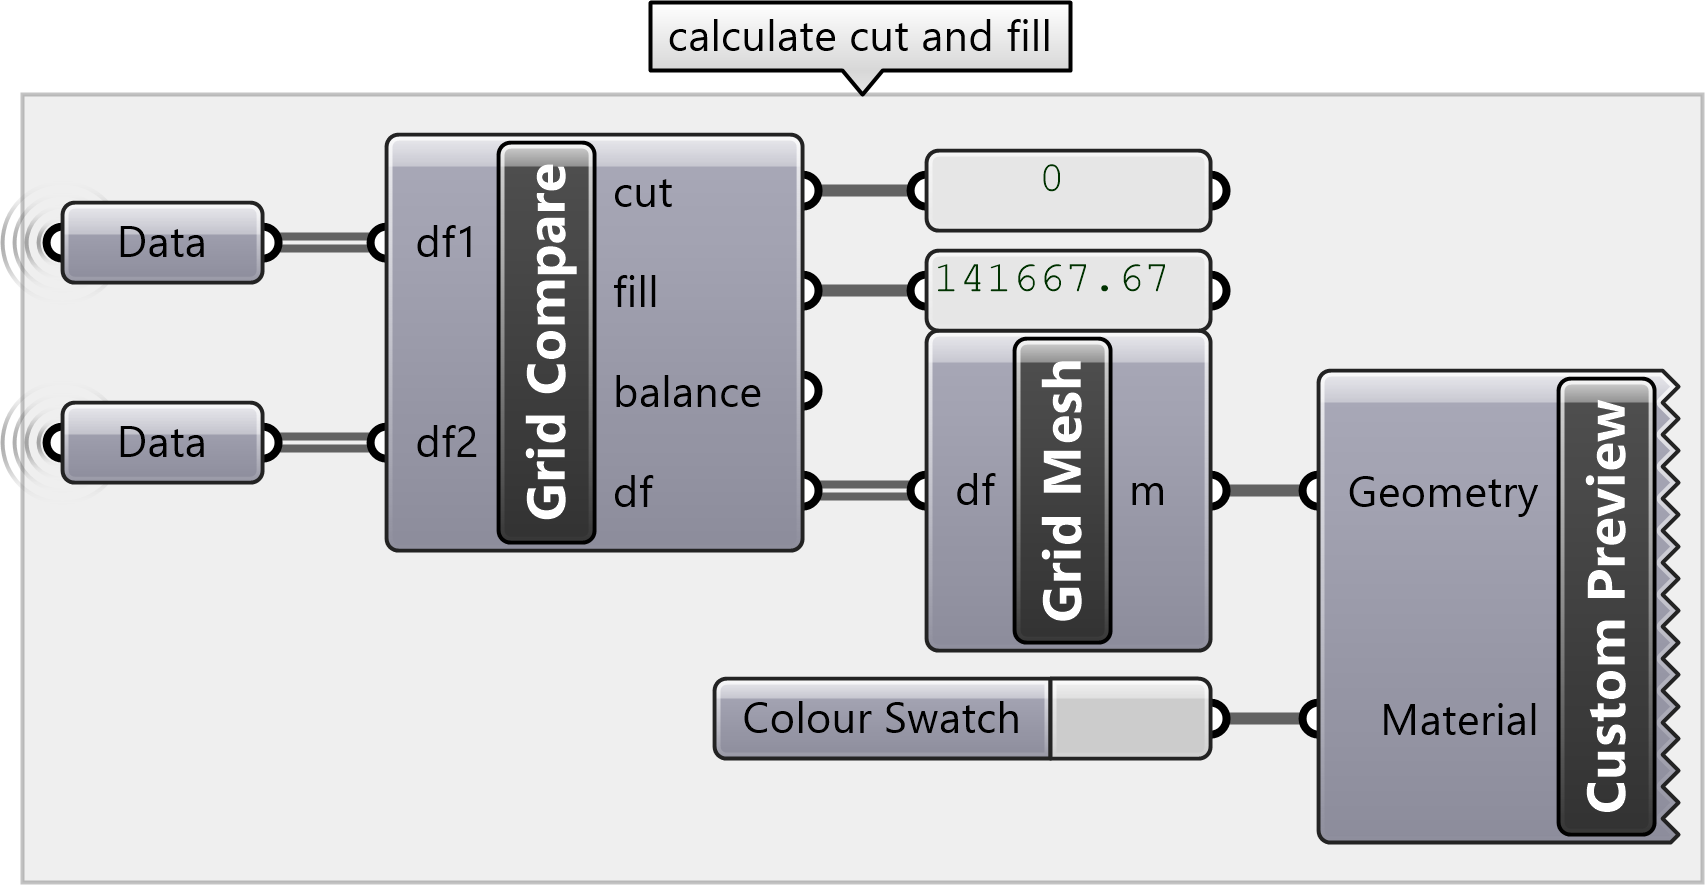
Cut & Fill
Calculate the volume of cut and fill with the dfGridCompare component. Connect the Docofossor list (df) before grading as the first input and the Docofossor list (df) after grading as the second input. Connect panels to the outputs to see the volume of cut, fill, and the balance (i.e. the difference in the volume).
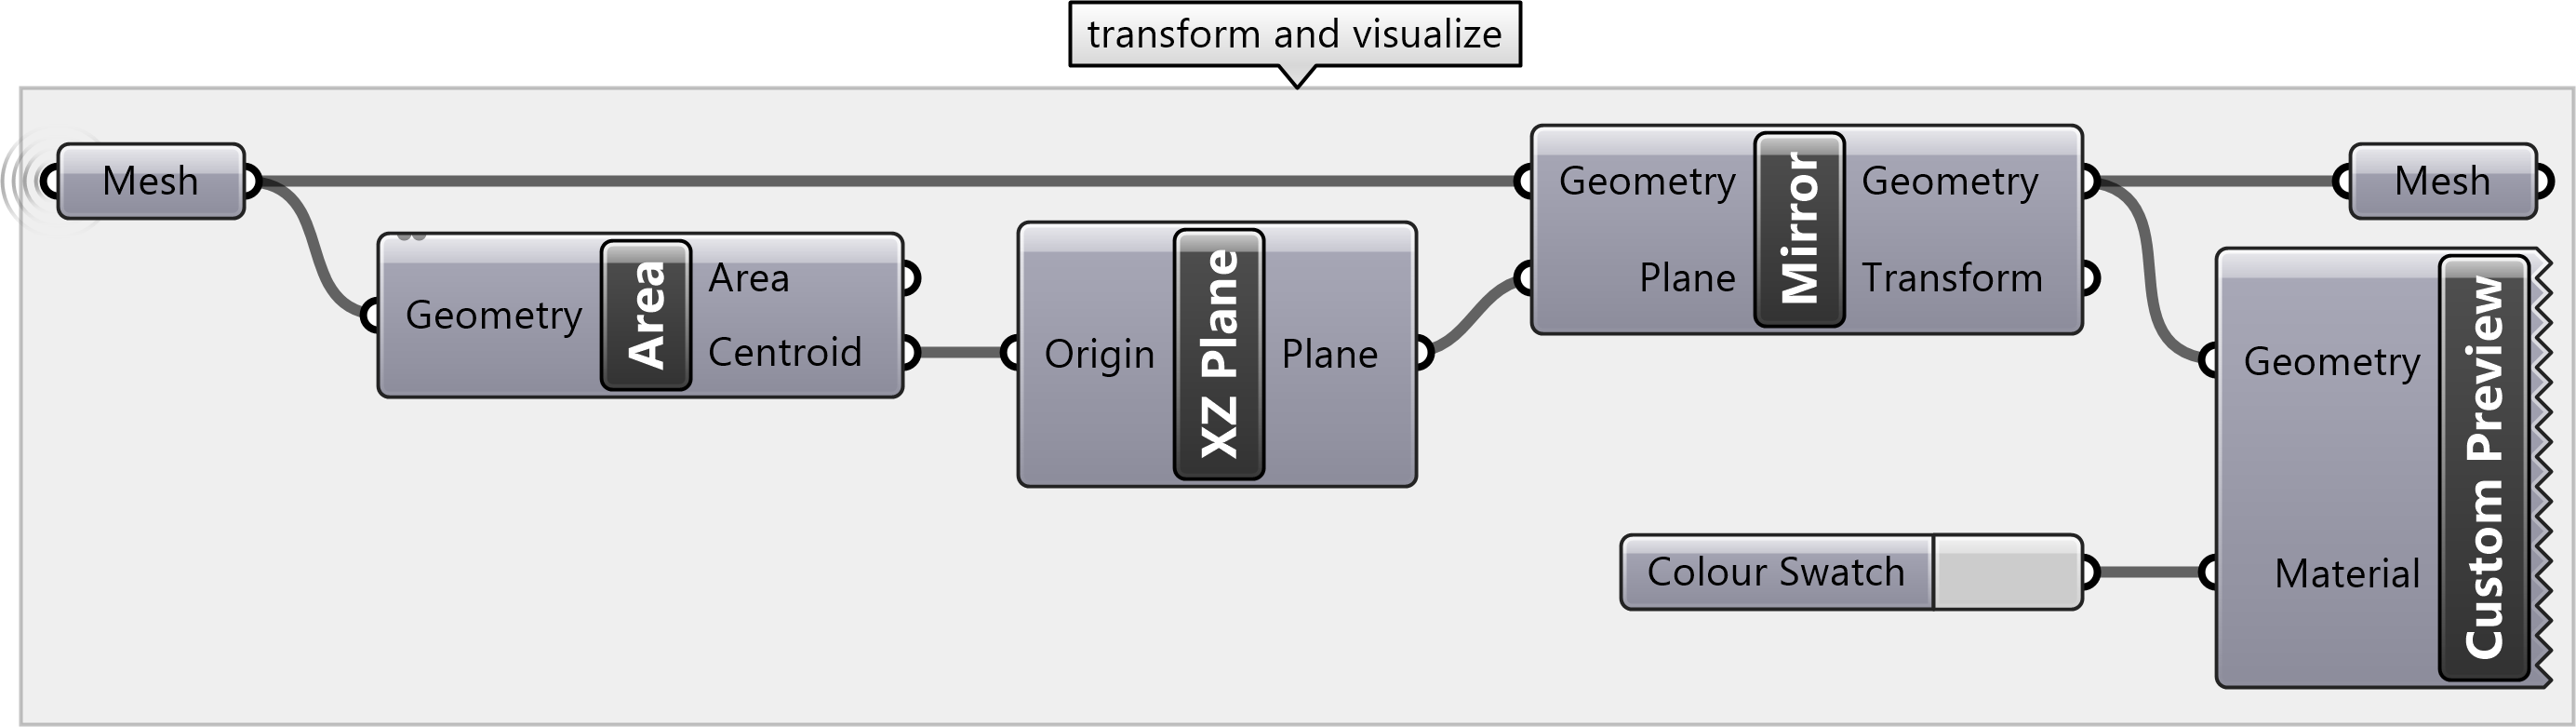
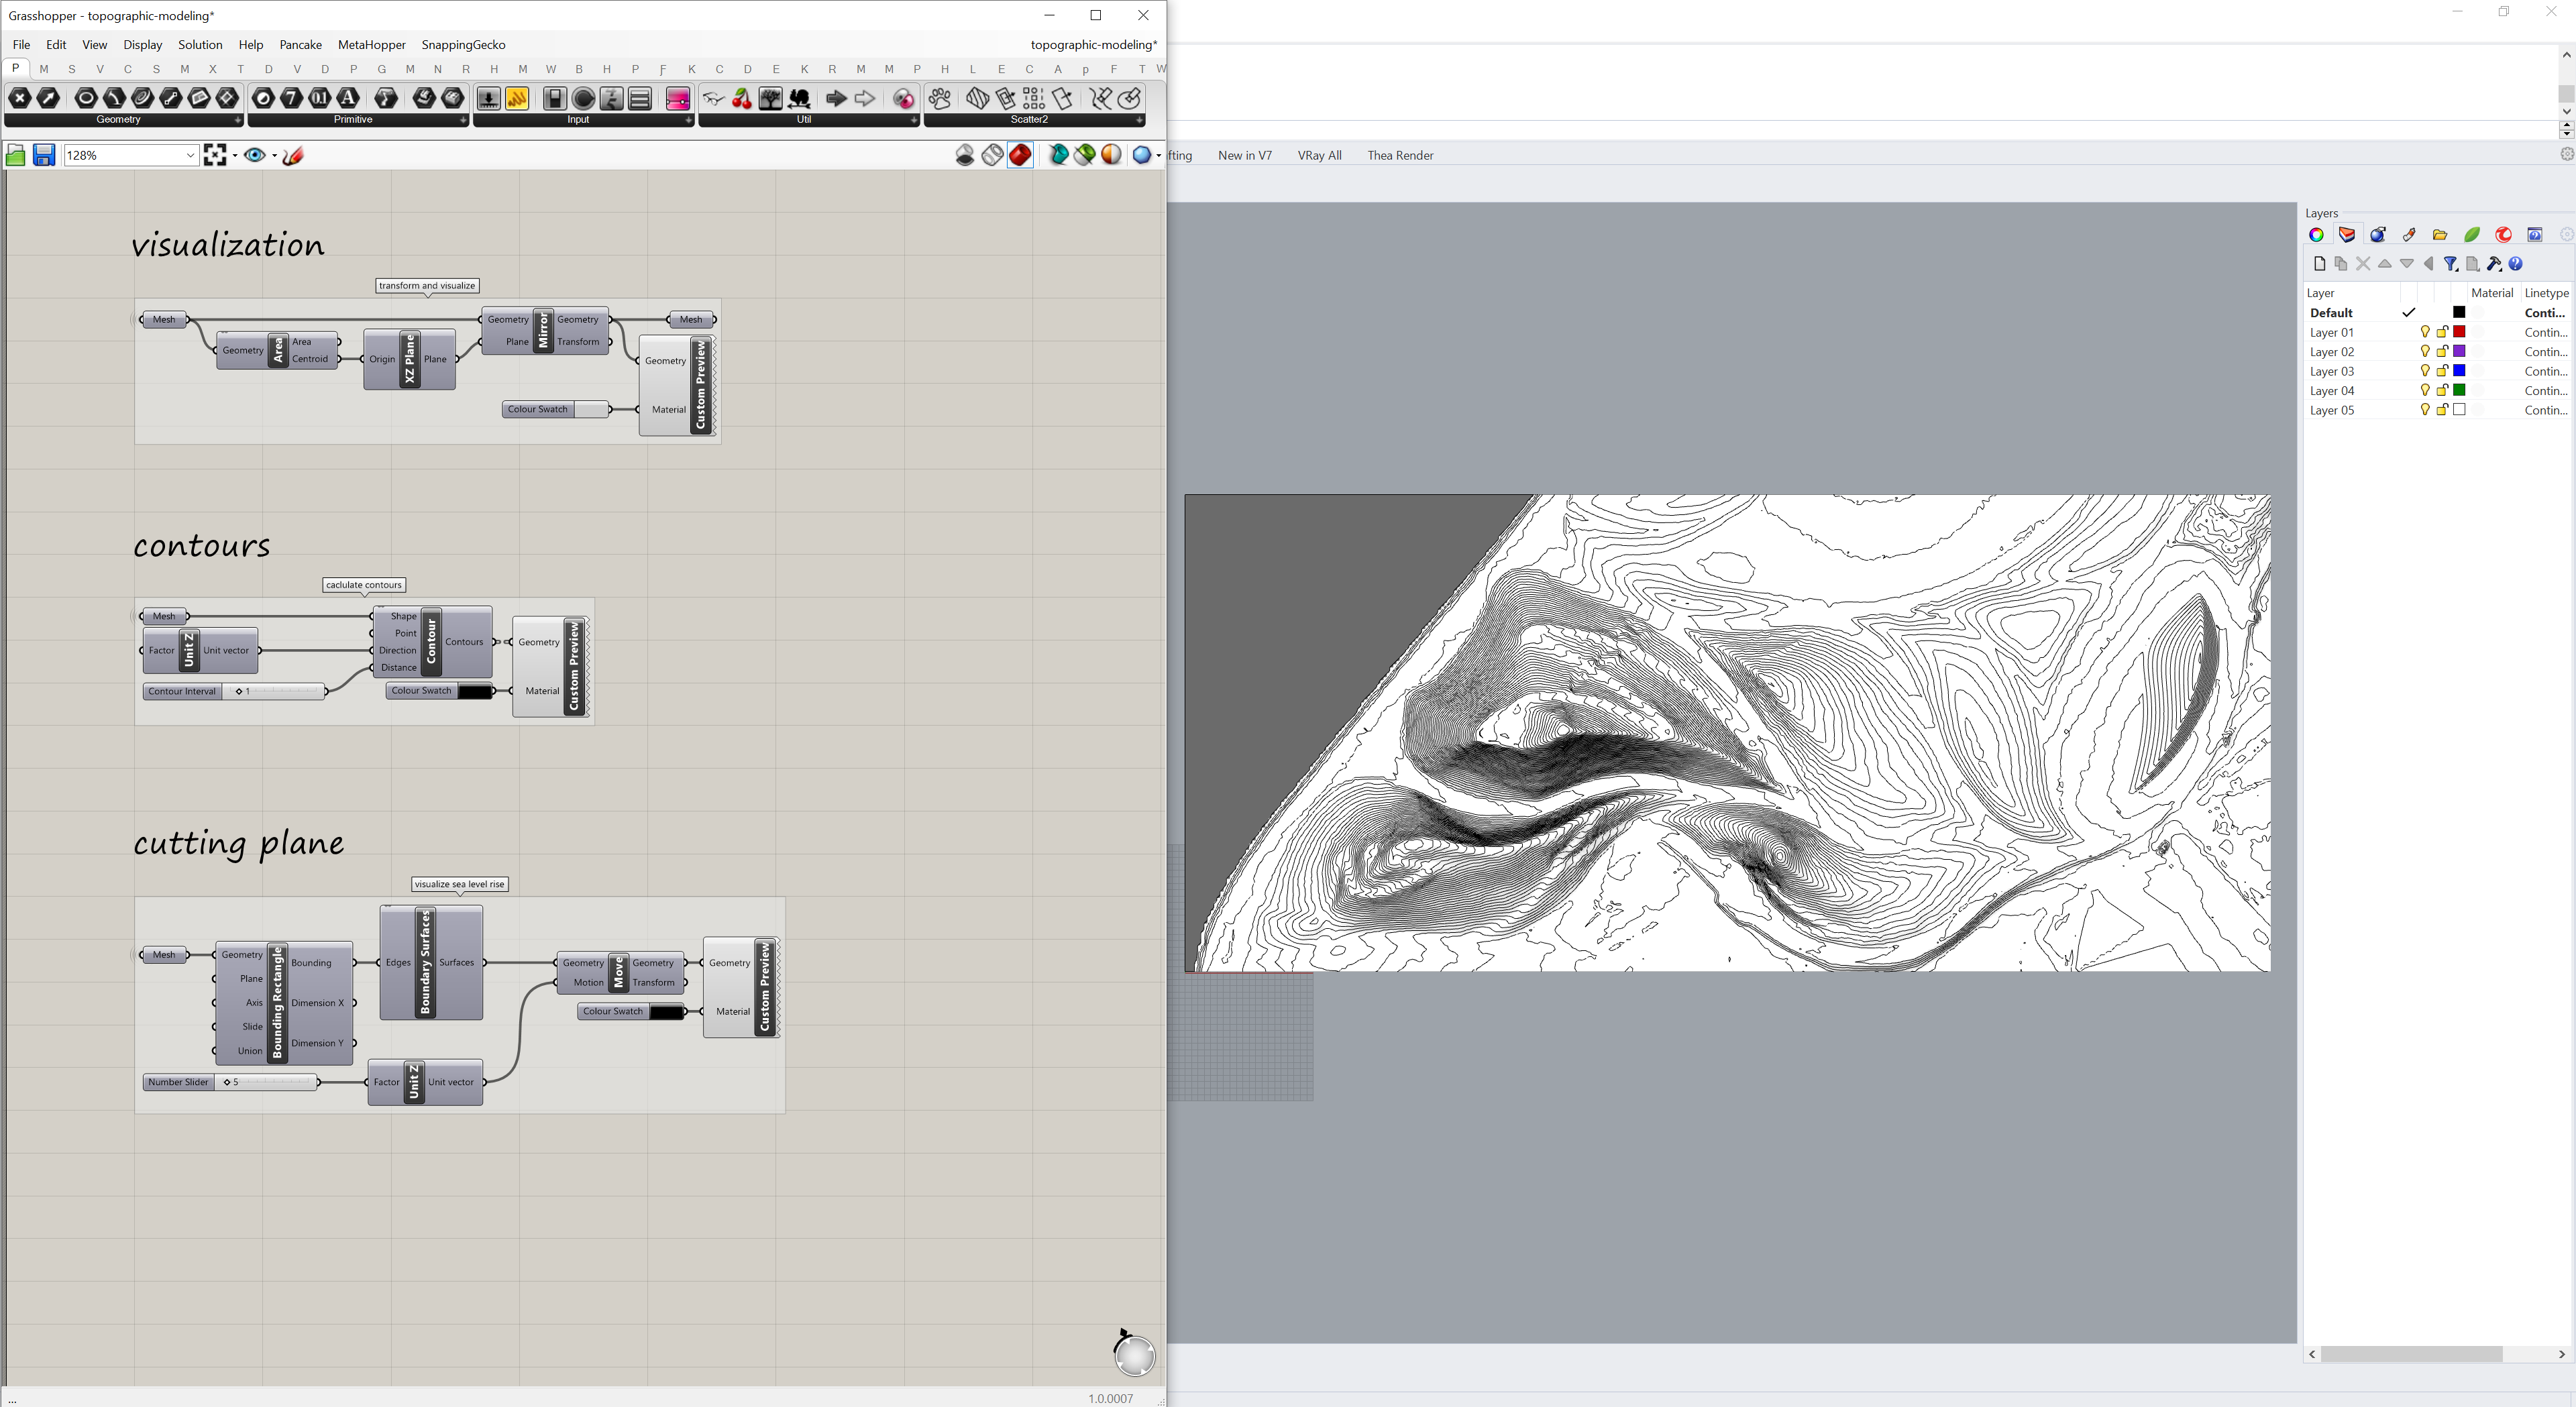
Visualization
Since Docofossor expects points to be listed from left to right and from bottom to top, XYZ point clouds that are sorted differently - such as governors-island-landform.xyz - will be mirrored vertically. To fix this use the mirror component with the grid mesh as the input geometry and an XZ plane with its origin set to the center of the mesh as the input plane. Find the center of the mesh using the area component. Connect a custom preview with a color swatch to the output mesh to better visualize the terrain.
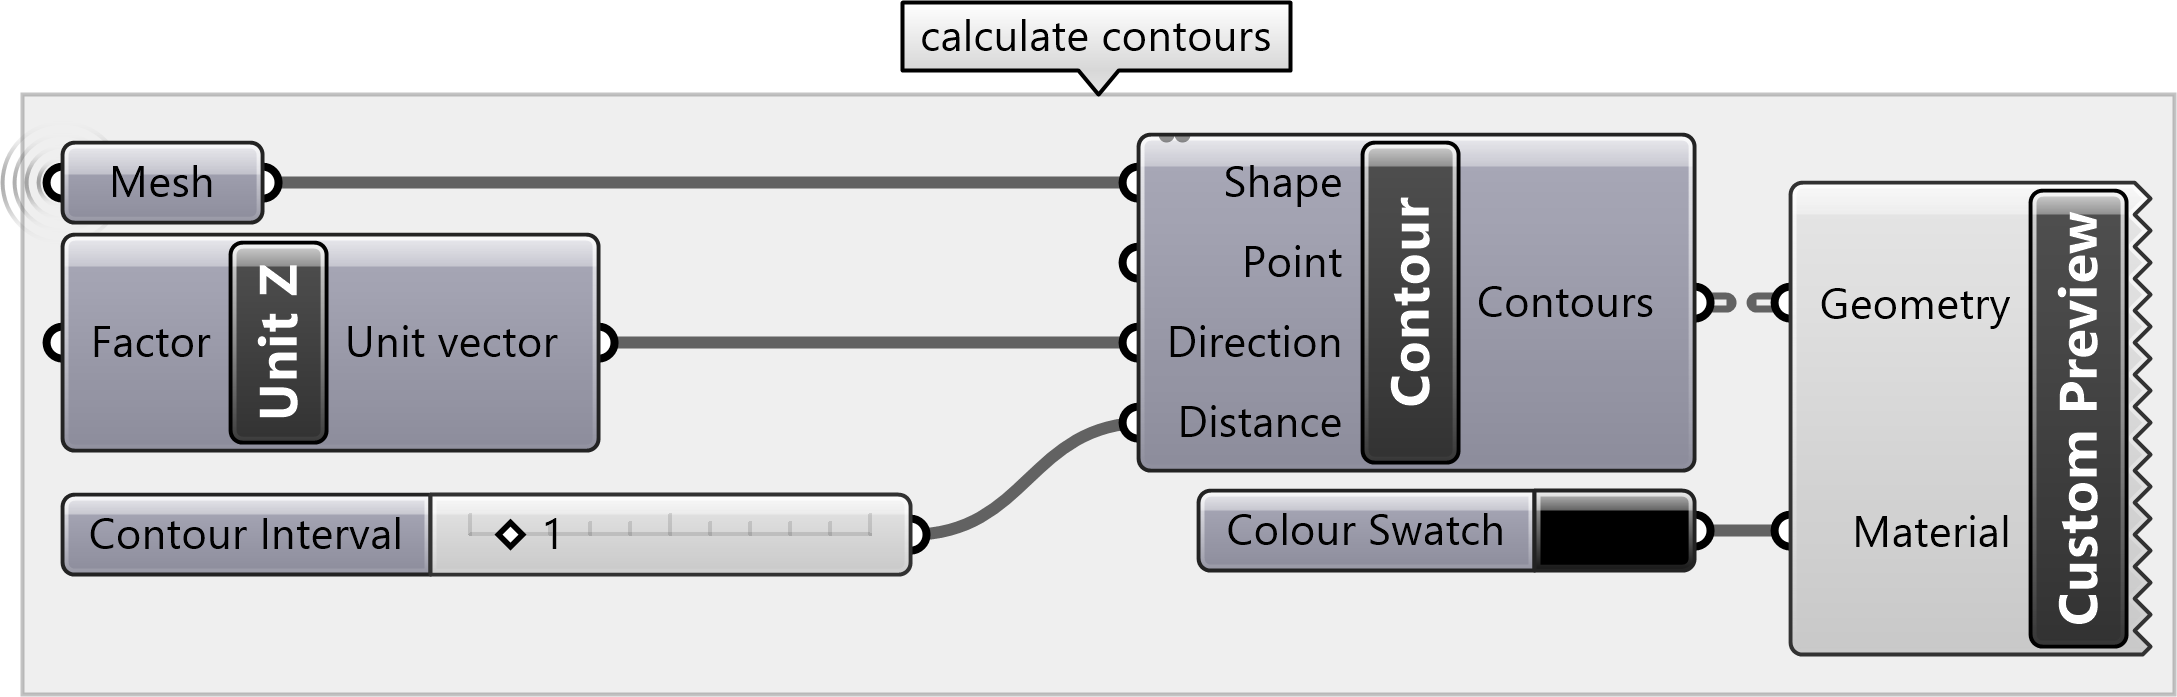
Contours
Generate contours from the mesh with the contour component. For the contour component, connect the terrain mesh as the input shape, the unit z vector as the input direction, and a number slider for the input distance. Connect a custom preview with a color swatch to the output mesh to better visualize the contours.
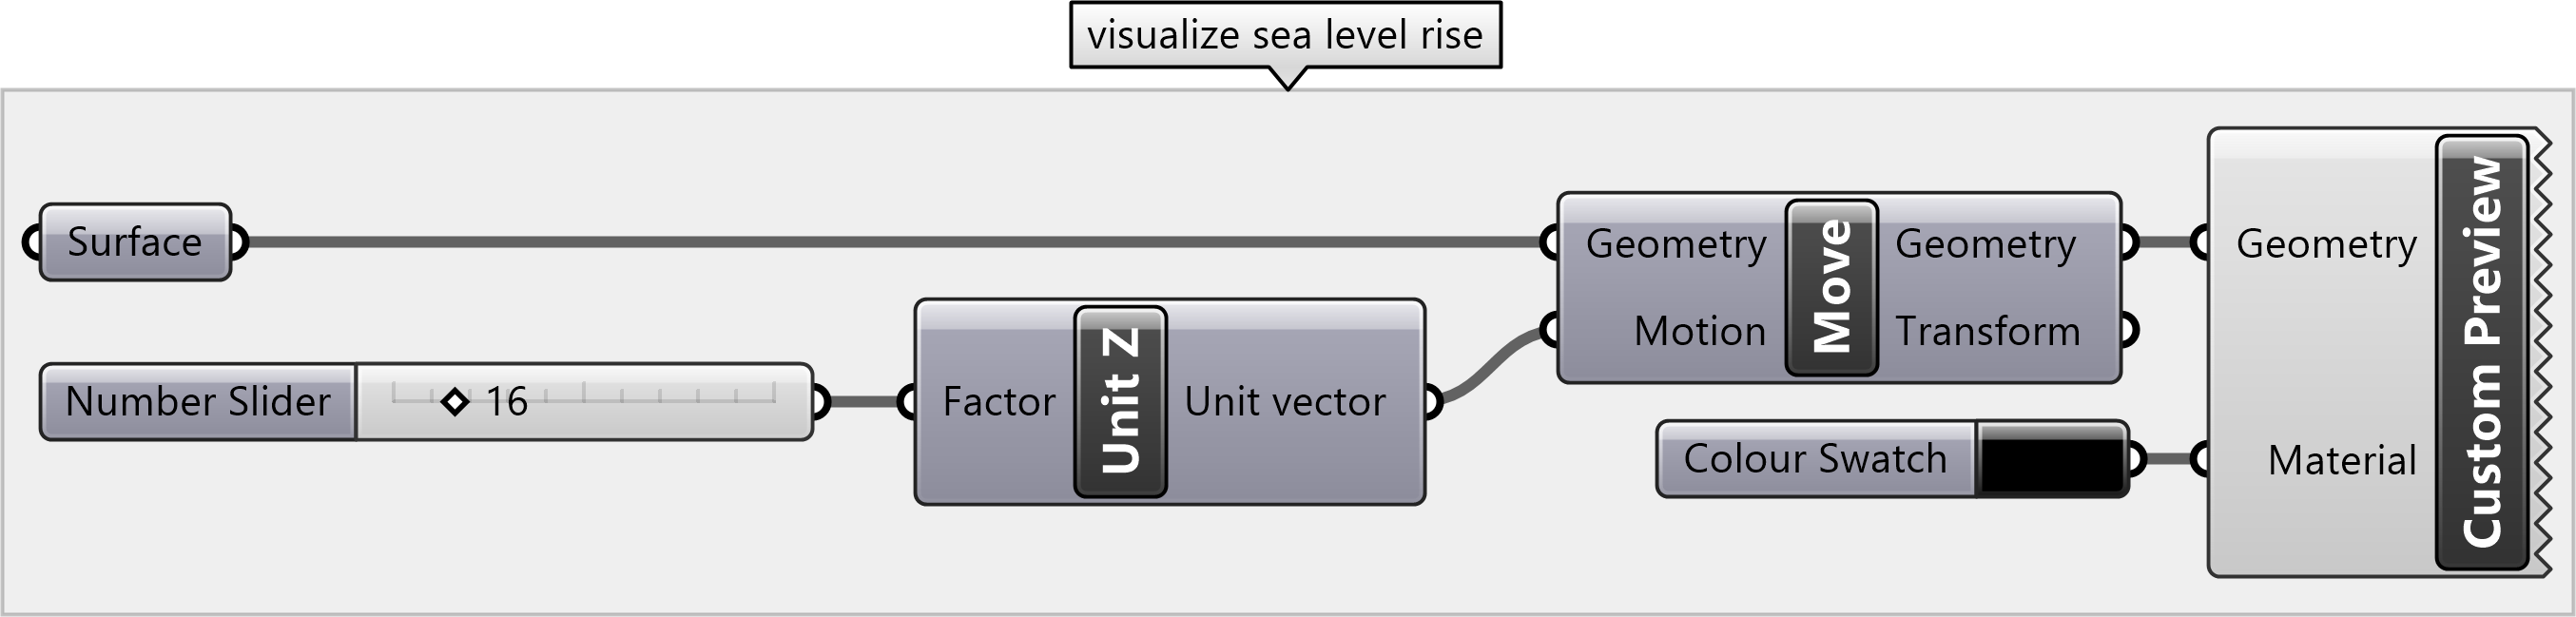
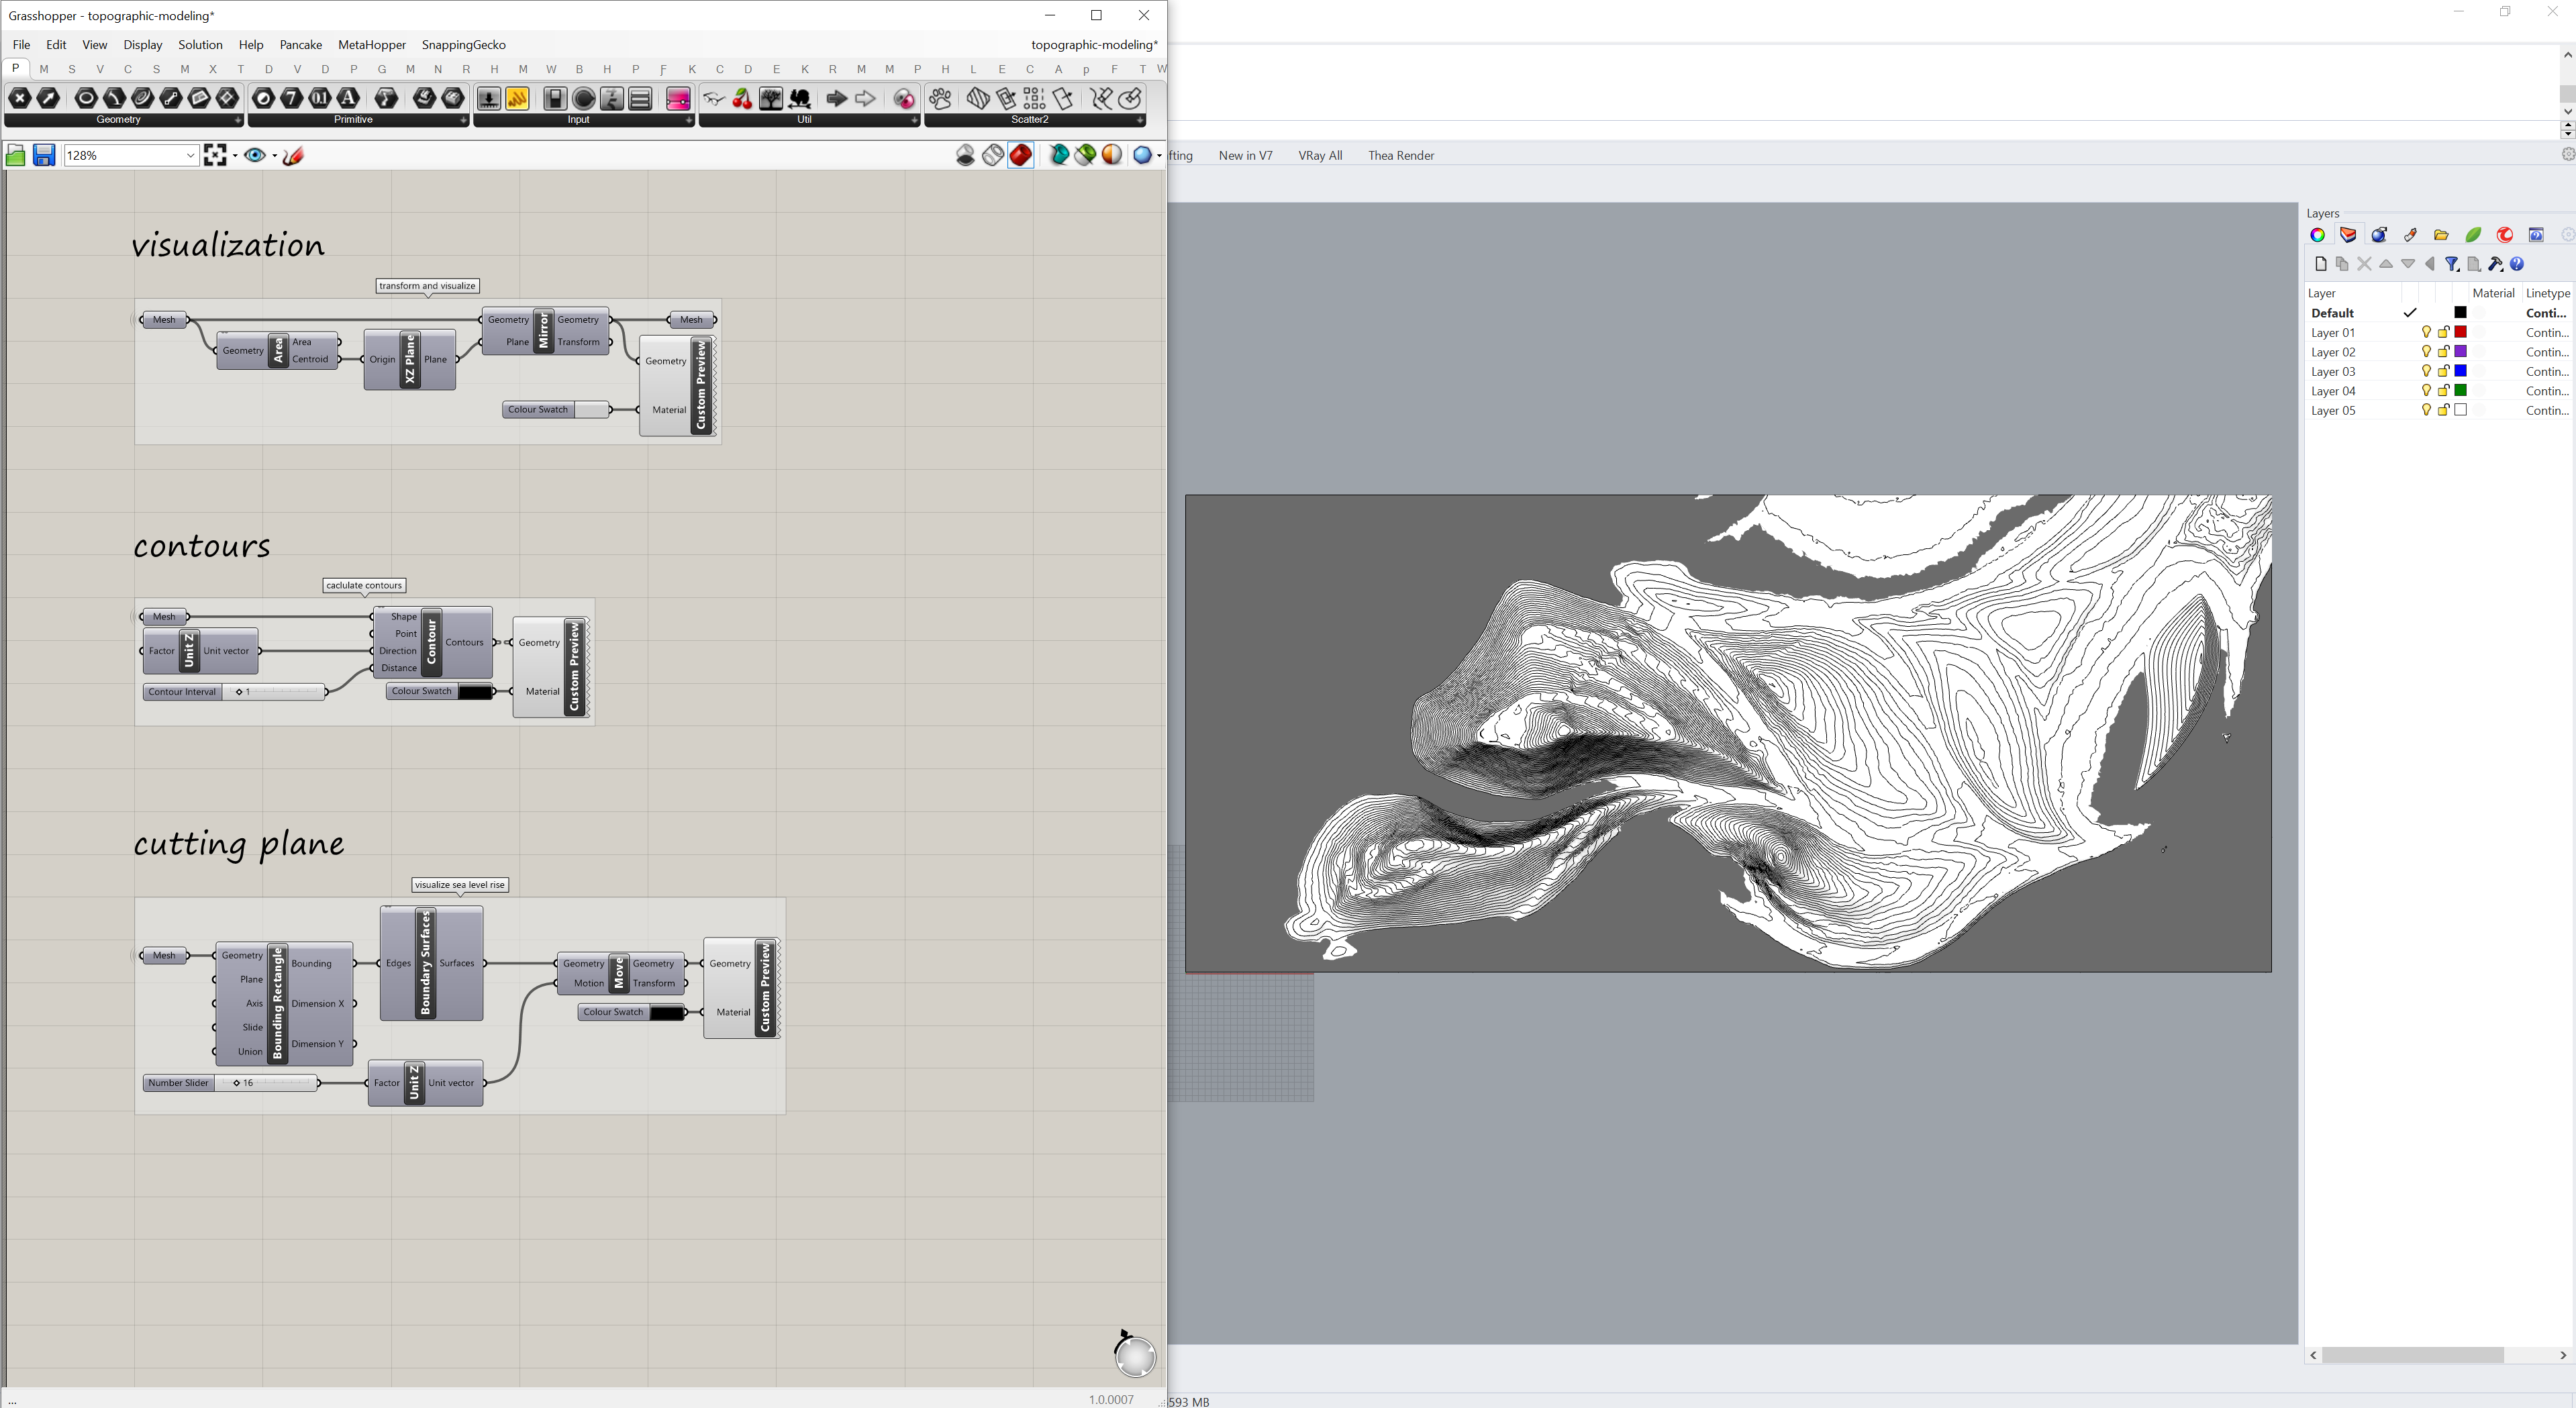
Cutting Plane
Use a cutting plane to visualize flooding or sea level rise. Create a surface and move it along the z-axis to visualize changes in sea level.
Resources
Grasshopper
- The Grasshopper Primer
- Grasshopper Docs
- Grasshopper Basics with David Rutten
- TU Delft Grasshopper Tutorials
Docofossor
- Docofossor Documentation
- Computational Terrain Modeling with Distance Functions for Large Scale Landscape Design