Map Algebra in GRASS GIS
A tutorial on map algebra in GRASS GIS.
Contents
- Dataset
- Start GRASS GIS
- Map Algebra
- Height Above Ground
- Tree Canopy
- Tree Canopy Height
- Figure Ground
Dataset
This tutorial uses the
Governor’s Island Dataset for GRASS GIS.
Download, extract, and move this geospatial dataset
for Governor’s Island in New York City
to your grassdata directory.
Start GRASS GIS
Start GRASS GIS,
set the GRASS GIS database directory to grassdata directory,
select nyspf_governors_island as your location,
and create a new mapset called map_algebra.
Set your computational region
to the raster map elevation_2017 at 1 foot resolution with the module
g.region.
Then set a mask to the vector map shoreline with the module
r.mask.
g.region raster=elevation_2017 res=1
r.mask vector=shoreline
Map Algebra
Map algebra performs logical, arithmetic, statistical, trigonometric, and bitwise operations on a set of raster maps. We will use map algebra to calculate the height of the trees at Governor’s Island.
Height Above Ground
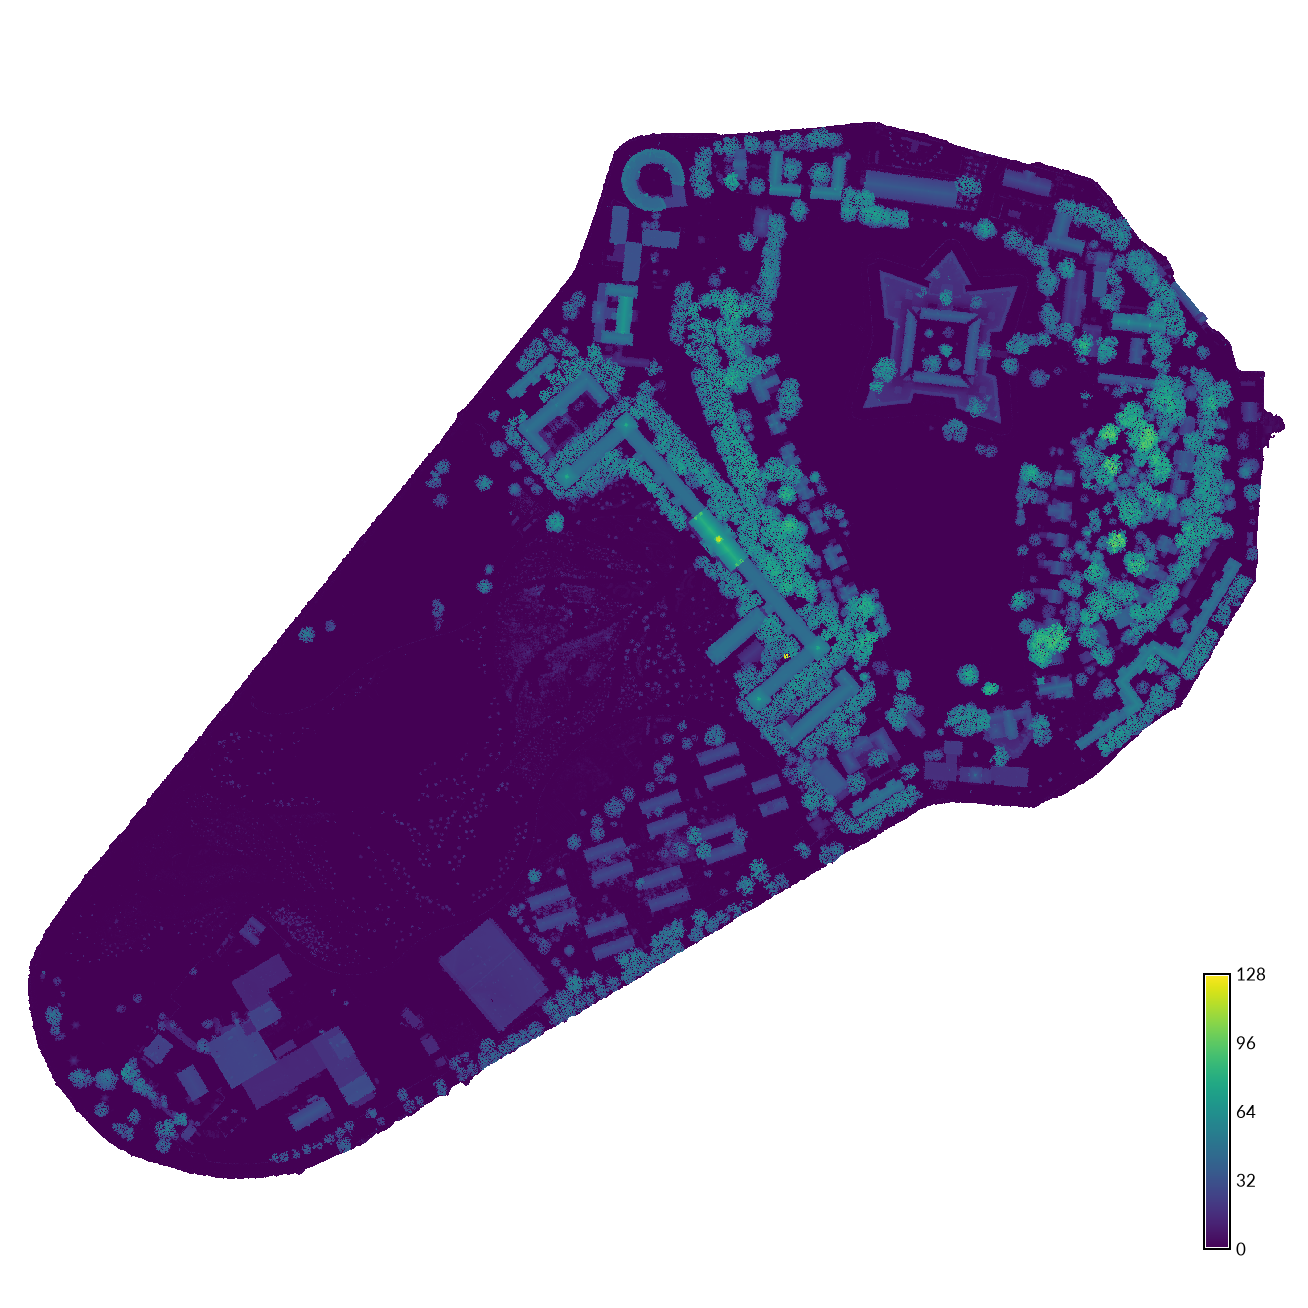
First we will use map algebra to calculate
the height of trees, buildings, and other objects above the ground.
Use the raster map calculator
r.mapcalc
to subtract the digital elevation model from the digital surface model.
r.mapcalc expression="height_above_ground = surface_2017 - elevation_2017"
| Height Above Ground, Governor’s Island, NYC |
|---|
 |
Tree Canopy
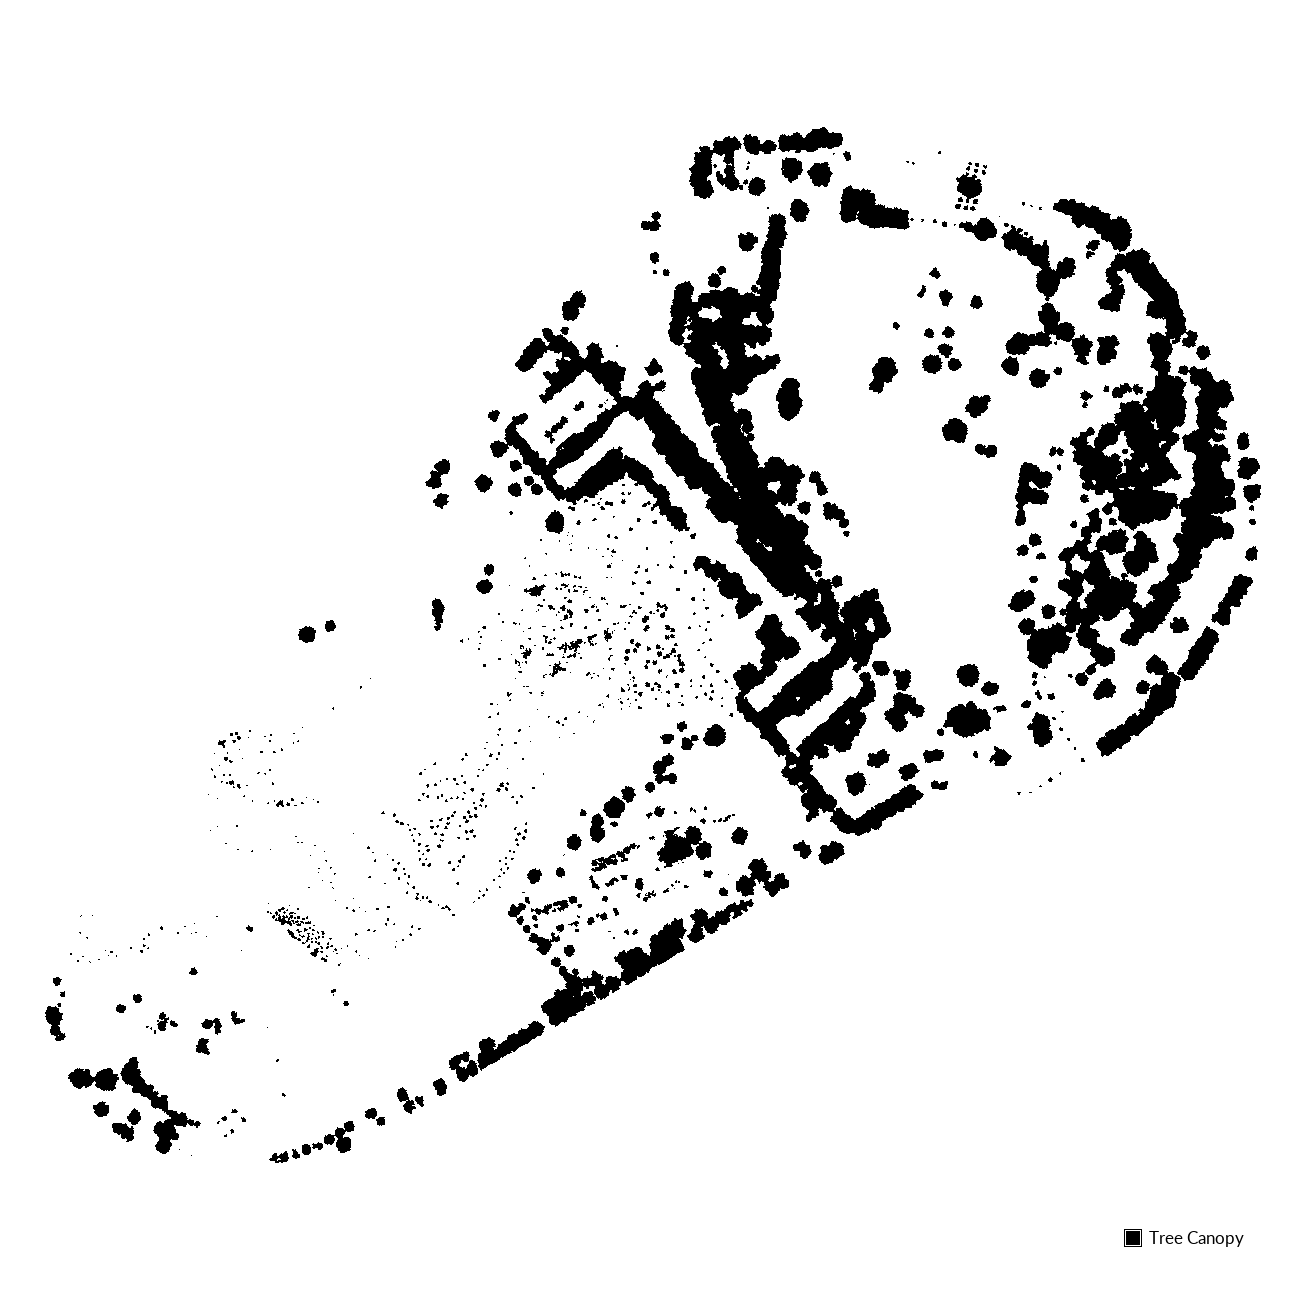
Next we will use map algebra to extract trees from the landcover map.
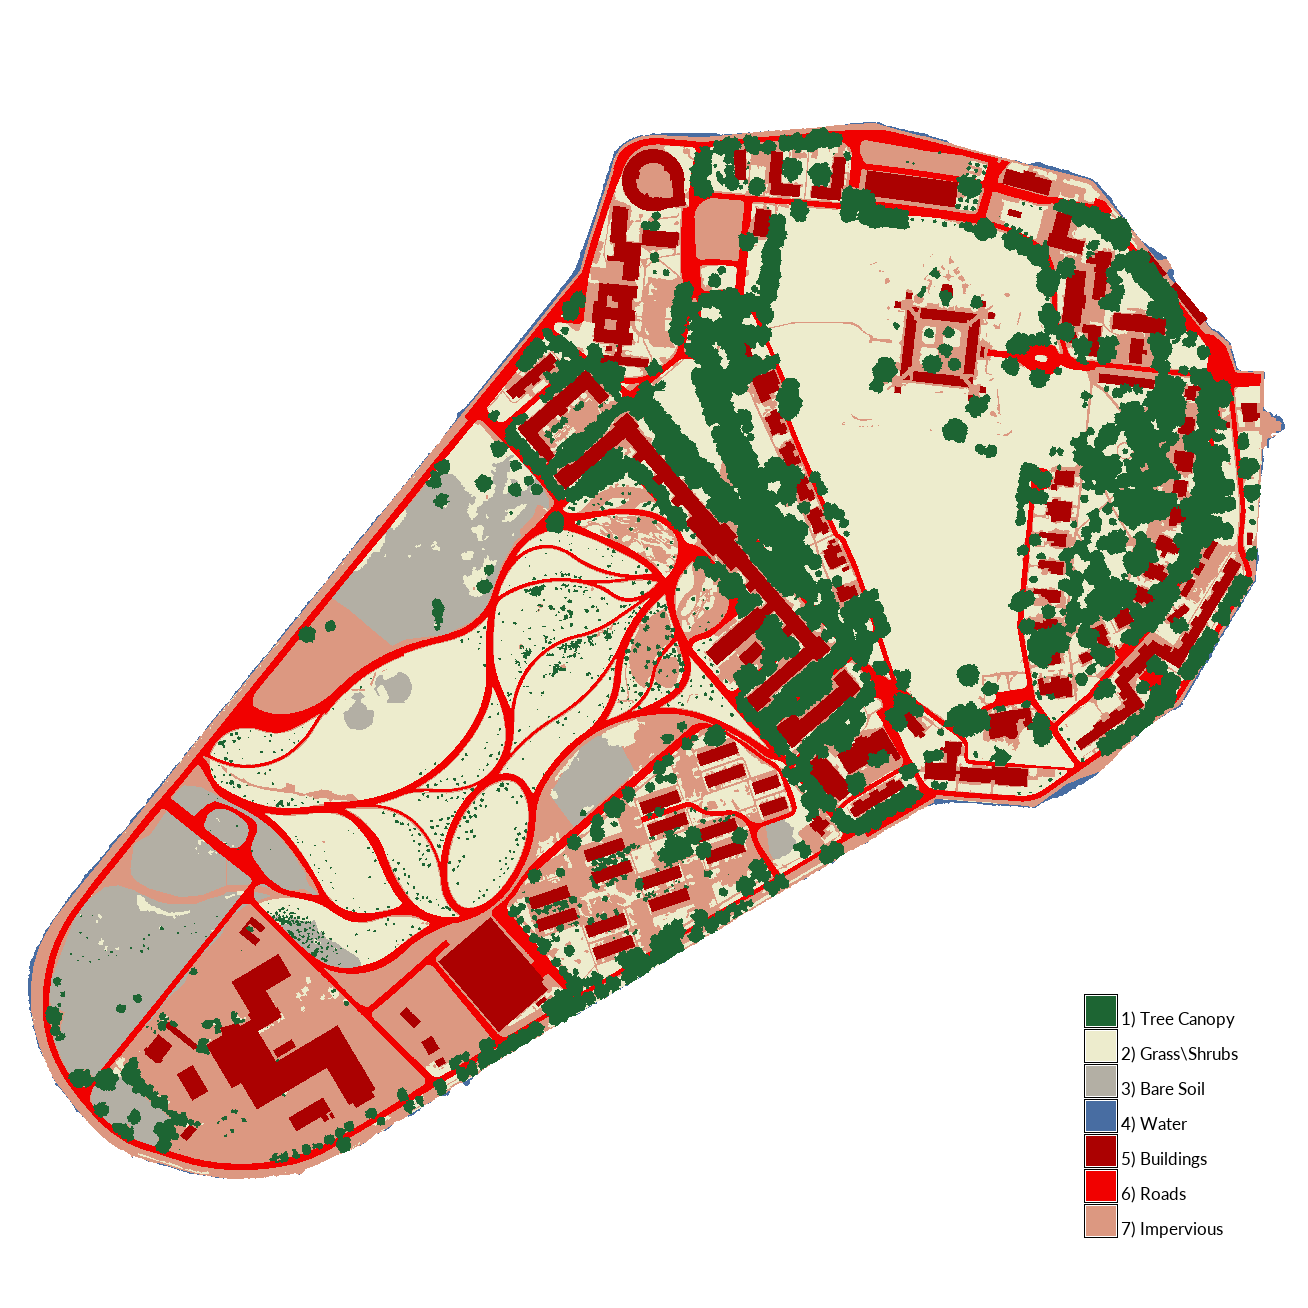
Add the raster map landcover_2014
and query it to check which value Tree Canopy has been assigned.
In this landcover classification scheme,
tree canopy has been assigned a value of 1.
Use the raster map calculator
r.mapcalc
to extract trees from the raster map of landcover.
r.mapcalc expression="canopy = if(landcover_2014 == 1, 1, null())"
In this expression use an if, then, else statement.
If cells in the landcover raster equal 1,
then write a value of 1 in the new raster,
else write null values.
Optionally assign category values from the landcover map to the canopy map with r.category.
r.category map=canopy raster=landcover_2014
| Tree Canopy, Governor’s Island, NYC |
|---|
 |
Tree Canopy Height
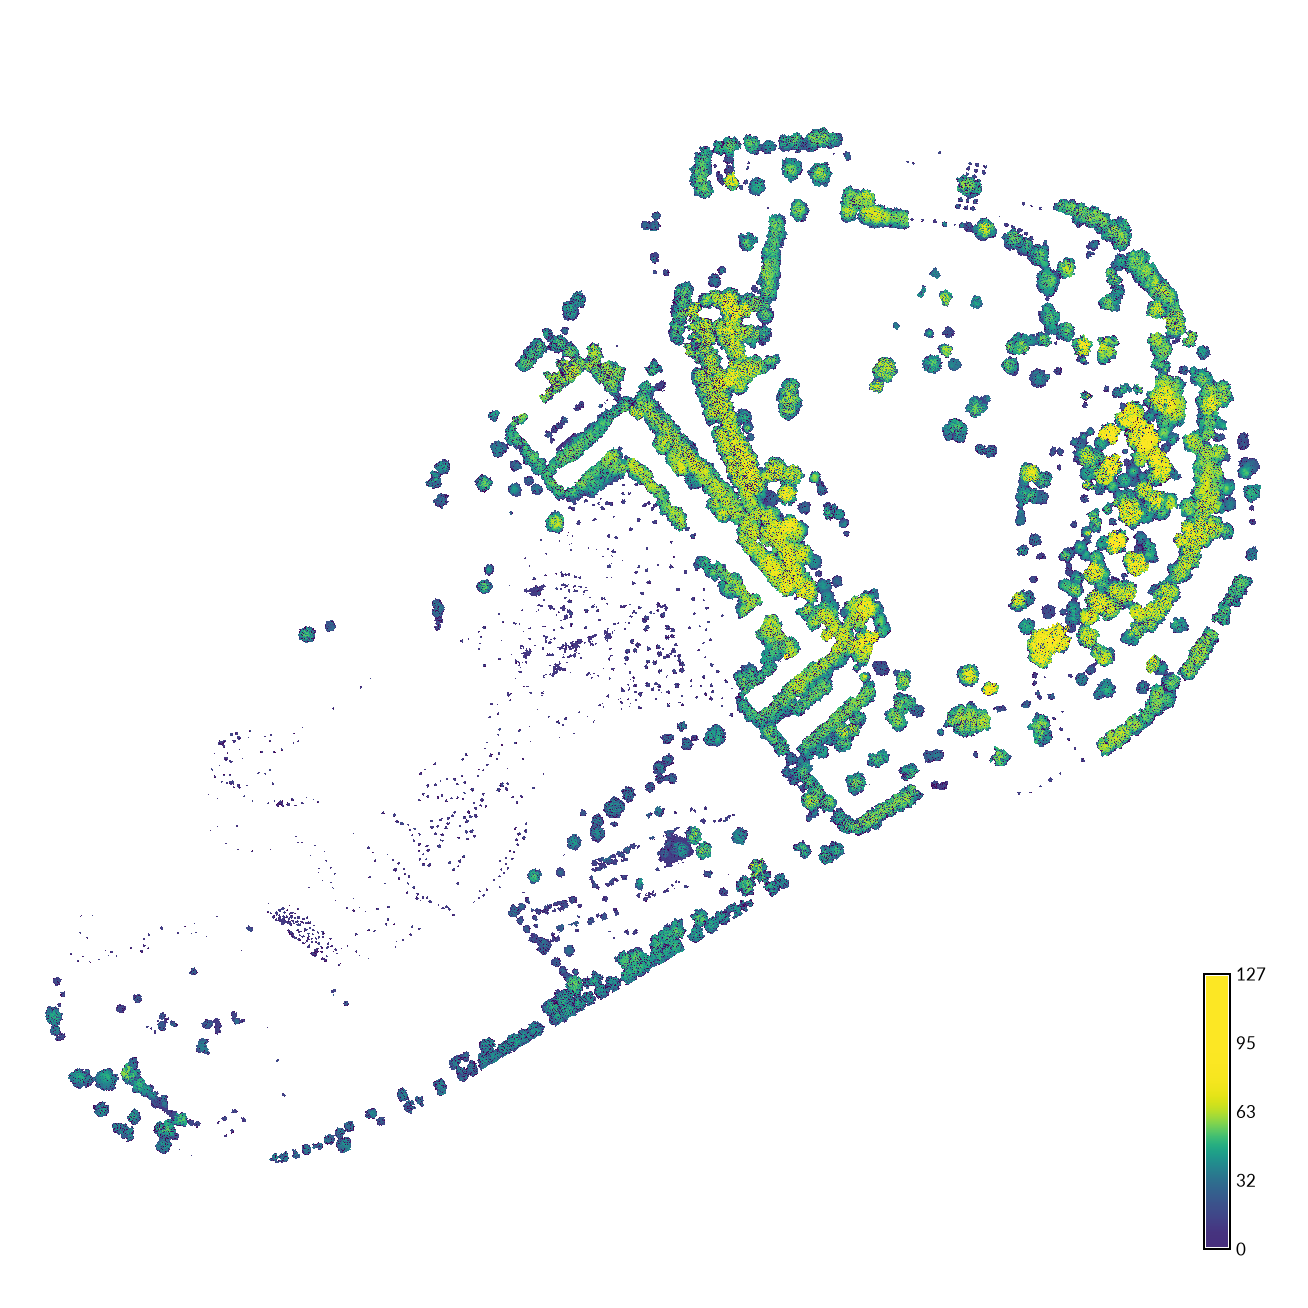
Next we will use map algebra to assign heights to the tree canopy.
Use the raster map calculator
r.mapcalc
with an if, then, else statement to extract the height the tree canopy.
r.mapcalc expression="canopy_height = if(isnull(canopy), null(), height_above_ground)"
This expression uses an if, then, else statement with an is null condition
to treat the canopy raster as a mask.
If cells in the canopy raster are null,
then write null values in the new raster,
else write the height above ground.
Assign a color table with histogram equalization to the new map.
r.colors -e map=canopy_height color=viridis
| Tree Canopy Height, Governor’s Island, NYC |
|---|
 |
Now write all of this map algebra in one command!
r.mapcalc expression="canopy_height = if(landcover_2014 == 1, surface_2017 - elevation_2017, null())" --overwrite
This expression reads
if cells in the landcover raster equal 1,
then write the difference between the surface and elevation rasters,
else write null values.
Use the --overwrite flag to replace the canopy_height raster
that we already computed.
Figure Ground
Figure ground maps represent built versus unbuilt urban space in high contrast. A famous example is the 1748 Map of Rome by Giambattista Nolli. See the Genealogy of Cities by Charles P. Graves Jr. for a study of urban morphology around the world using figure ground maps.
| Giovanni Battista Nolli, Nuova Pianta di Roma, 1748 |
|---|
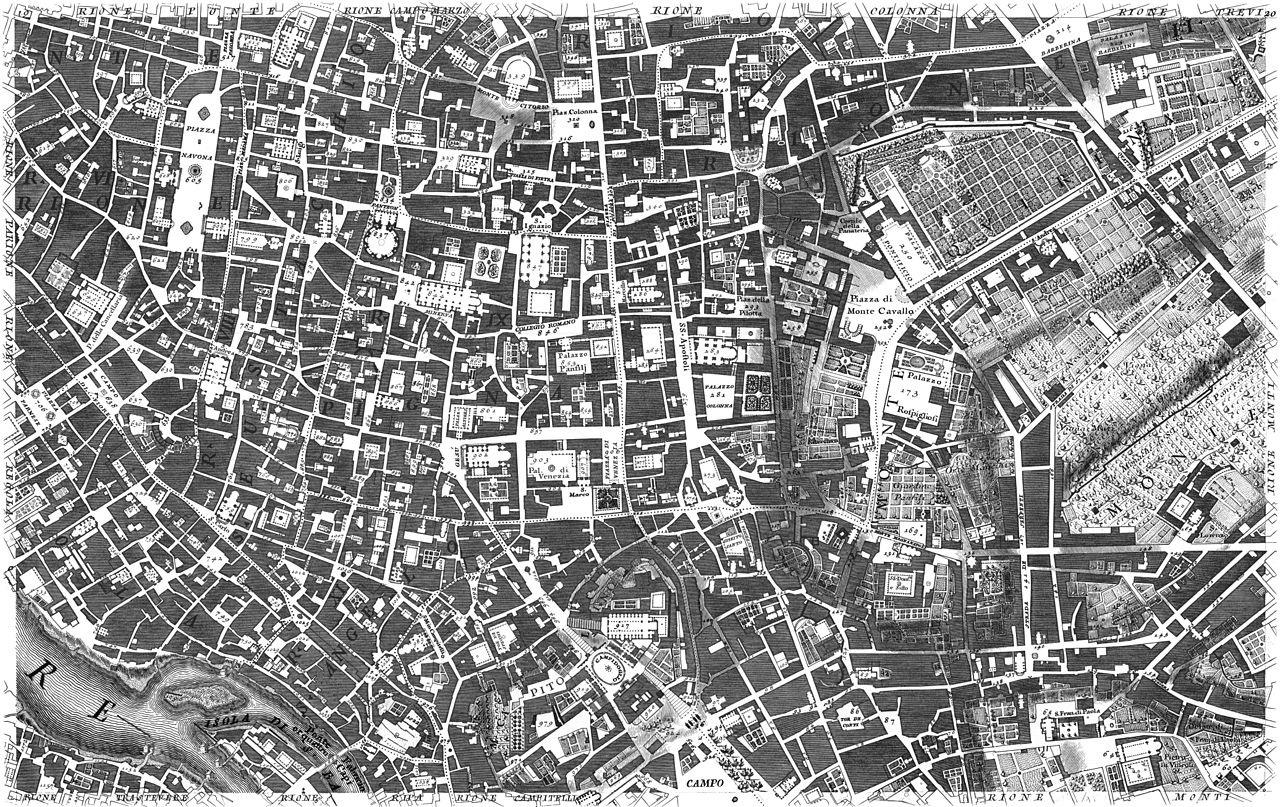 Wikimedia Commons Wikimedia Commons |
_05-12.JPG)
Use map algebra to extract buildings from the landcover map.
Query the raster map landcover_2014
to check which value Buildings has been assigned.
In this landcover classification scheme,
buildings have been assigned a value of 5.
Use the raster map calculator
r.mapcalc
to extract buildings from the raster map of landcover.
r.mapcalc expression="figure_ground = if(landcover_2014 == 5, 1, null())"
This expression reads if cells in the landcover raster equal 5, then write a value of 1 in the new raster, else write null values.
Right click on the figure_ground map in the Layer Manager
and select set color table interactively.
Set the color for value 1 to black.
| Figure Ground, Governor’s Island, NYC |
|---|
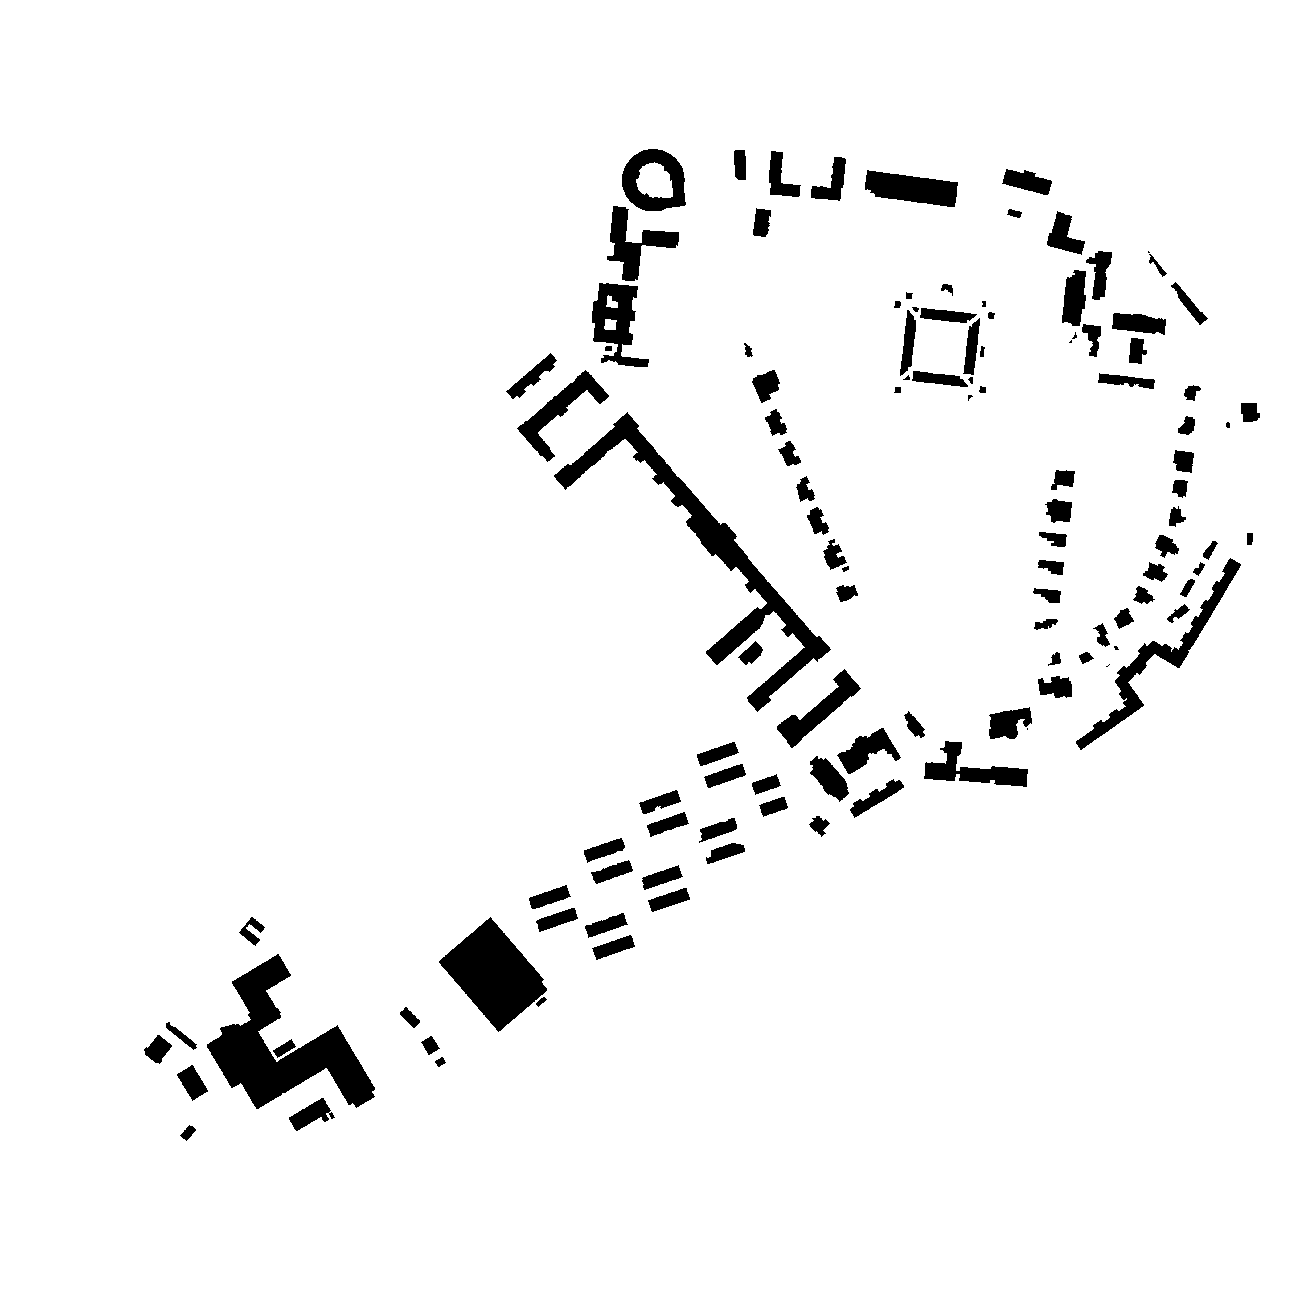 |
Optionally add the canopy map to the display and interactively set its color table with value 1 as red.
| Figure Ground with Tree Canopy, Governor’s Island, NYC |
|---|
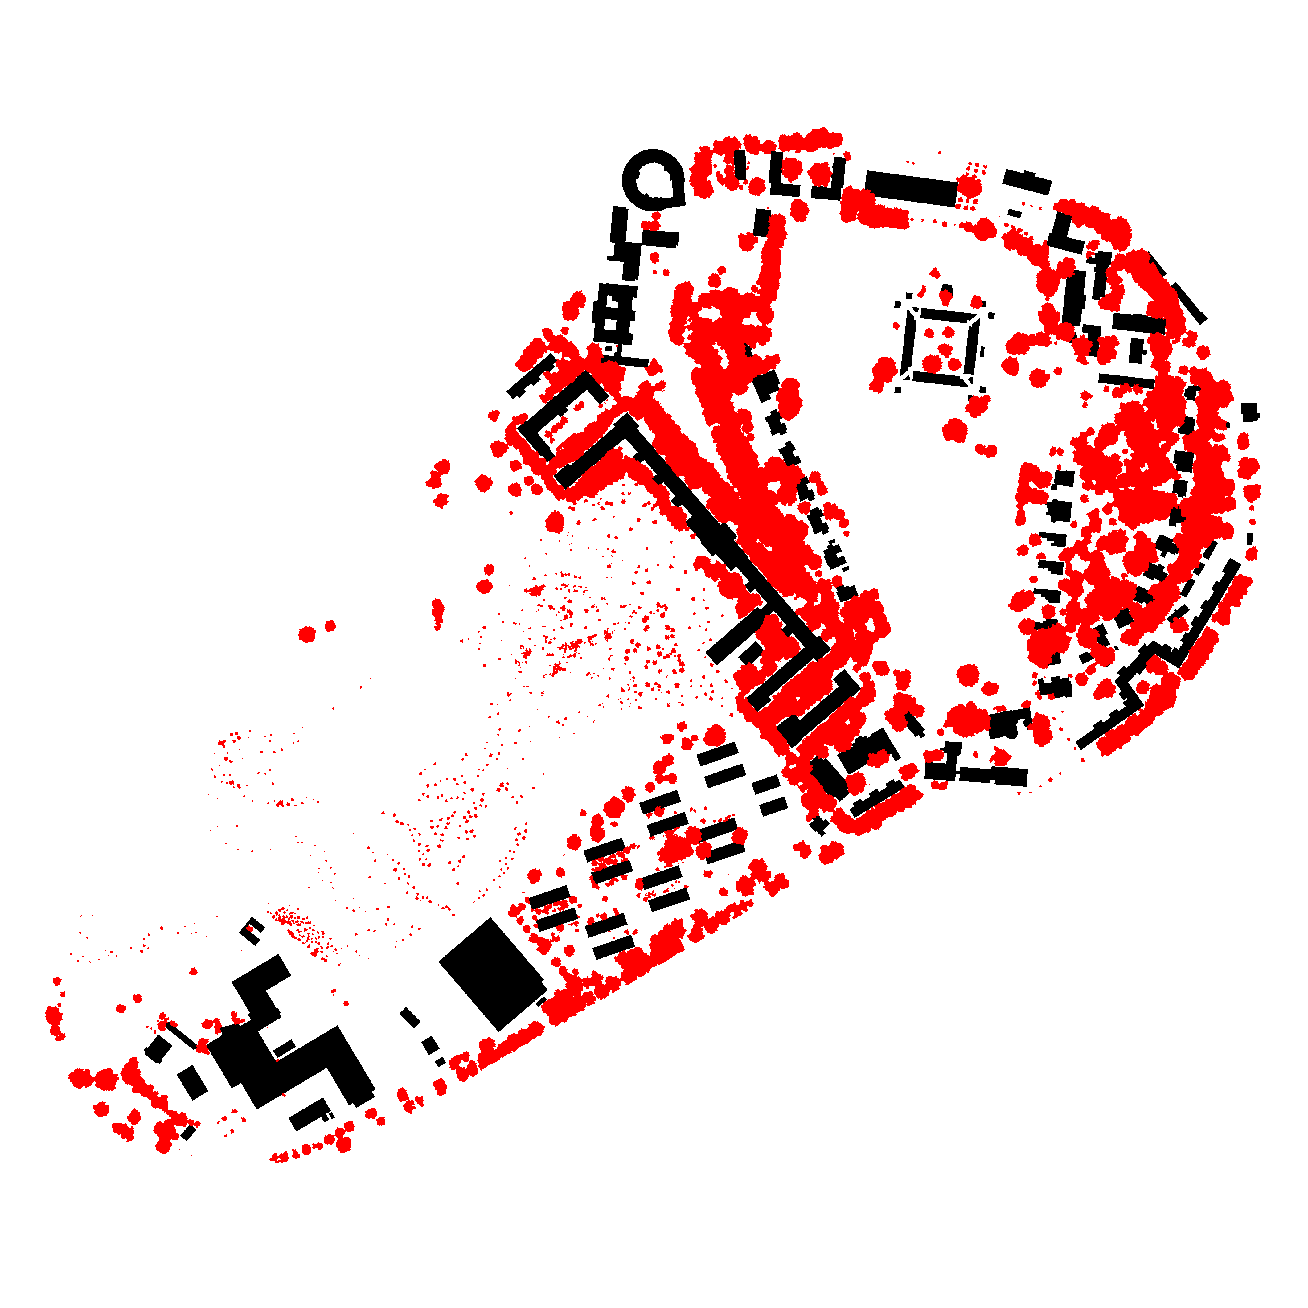 |